Page 313 - NUMINO_WB_6B
P. 313
097-P3-1
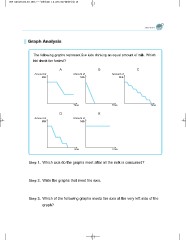
Graph Analysis
The following graphs represent five kids drinking an equal amount of milk. Which
kid drank the fastest?
A B C
Amount of Amount of Amount of
Milk Milk Milk
Time Time Time
D E
Amount of Amount of
Milk Milk
Time Time
Step 1. Which axis do the graphs meet after all the milk is consumed?
Step 2. Write the graphs that meet the axis.
Step 3. Which of the following graphs meets the axis at the very left side of the
graph?


