Page 365 - NUMINO_WB_2B
P. 365
176-S1-1
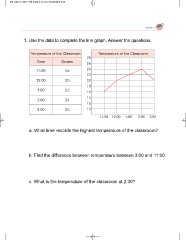
1. Use the data to complete the line graph. Answer the questions.
Temperature of the Classroom Temperature of the Classroom
11:00 12:00 1:00 2:00 3:00
Time Scores 28
26
11:00 16 24
22
12:00 20 20
18
1:00 22 16
14
2:00 24 12
10
3:00 20
a. What time records the highest temperature of the classroom?
b. Find the difference between temperature between 3:00 and 11:00.
c. What is the temperature of the classroom at 2:30?


