
Page 10 - report P Lemoine feb 2013c
P. 10
10
Clearly, as for the L-d curves, the E and H values display a large scatter, a sign of
the heterogeneous nature of the sample surfaces. These variations are not only
caused by the various phases present in these cementious samples but also by the
topographical imperfections. Every time the indenter probes a volume containing
gaps or cracks, this results in discontinuities in the L-d curves and hence further
scatter in the data. Similar variations were observed in previous nanoindentation
4
studies of cementous material. In addition, figure 3 and 4 show that
· The Y fired sample has slightly more occurrence of high E and H values than
any of the other samples.
· The no Y as rec sample has the lowest E and H values of all measured
samples. This result may be, partially due to its rougher surface.
random positioning
80
Young modulus, GPa 40
60
20
0
Y asrec Y fired Y N2 Y acid no Y asrec
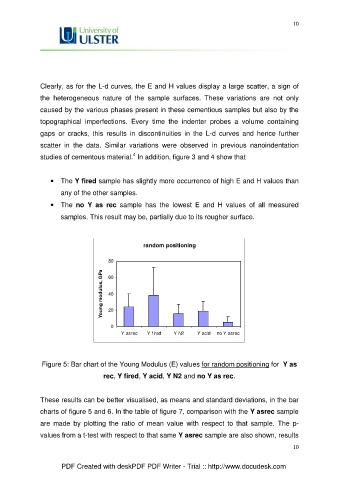
Figure 5: Bar chart of the Young Modulus (E) values for random positioning for Y as
rec, Y fired, Y acid, Y N2 and no Y as rec.
These results can be better visualised, as means and standard deviations, in the bar
charts of figure 5 and 6. In the table of figure 7, comparison with the Y asrec sample
are made by plotting the ratio of mean value with respect to that sample. The p-
values from a t-test with respect to that same Y asrec sample are also shown, results
10
PDF Created with deskPDF PDF Writer - Trial :: http://www.docudesk.com