Page 71 - PowerPoint Presentation
P. 71

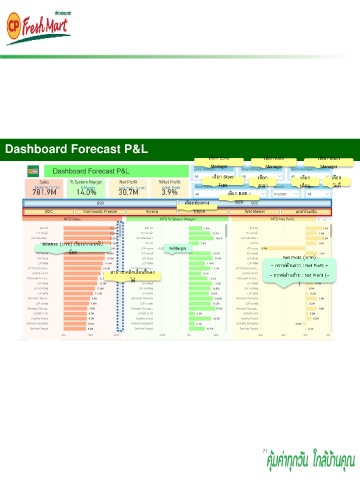
Dashboard Forecast P&L
                                                                เลือก Zone      เลือก Area      เลือก Team
                                                                Manager          Manager         Manager
                                                                 เลือก Store   เลือก       เลือก     เลือก
                                                                   Type       สาขา         เดือน     วันที่
           ยอดขาย (บาท)  %Margin     Net Profit (บาท)  %Net Profit
                                                                     เลือก B2B /
                                                        เลือกช่องทาง    B2C
                                                           ขาย


              ยอดขาย (บาท) เรียงจากมากไป
                                                    %Margin
                      น้อย
                                                                                      Net Profit (บาท)
                                                                                  - กราฟด้านขวา : Net Profit +
                                  สามารถคลิกเลื่อนขึ้นลง
                                                                                  - กราฟด้านซ้าย : Net Profit (-
                                        ได้
                                                                                           )


                                                                                71
   66   67   68   69   70   71   72   73   74   75   76