
Page 4 - art
P. 4
Advances in Social Science, Education and Humanities Research, volume 176
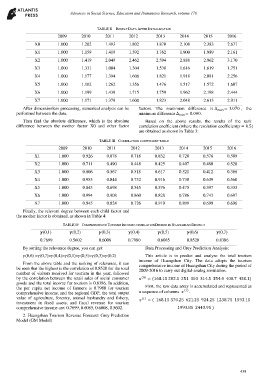
TABLE II RESULT DATA AFTER INITIALIZATION
2009 2010 2011 2012 2013 2014 2015 2016
X0 1.000 1.202 1.493 1.802 1.870 2.108 2.383 2.677
X1 1.000 1.159 1.419 1.592 1.762 1.900 1.989 2.161
X2 1.000 1.419 2.049 2.462 2.594 2.888 2.962 3.170
X3 1.000 1.331 1.084 1.304 1.538 1.616 1.619 1.751
X4 1.000 1.177 1.394 1.606 1.821 1.918 2.081 2.256
X5 1.000 1.102 1.262 1.356 1.476 1.517 1.572 1.607
X6 1.000 1.199 1.439 1.715 1.759 1.962 2.198 2.444
X7 1.000 1.171 1.379 1.600 1.823 2.048 2.613 2.911
After dimensionless processing, numerical analysis can be factors. The maximum difference is ∆ = 1.070 , the
performed between the data. minimum difference ∆ = 0.000.
Then find the absolute difference, which is the absolute Based on the above results, the results of the rank
difference between the mother factor X0 and other factor correlation coefficient (where the resolution coefficientp = 0.5)
are obtained as shown in Table 3:
TABLE III CORRELATION COEFFICIENT TABLE
2009 2010 2011 2012 2013 2014 2015 2016
X1 1.000 0.926 0.878 0.718 0.832 0.720 0.576 0.509
X2 1.000 0.711 0.490 0.448 0.425 0.407 0.480 0.520
X3 1.000 0.806 0.567 0.518 0.617 0.521 0.412 0.366
X4 1.000 0.955 0.844 0.732 0.916 0.738 0.639 0.560
X5 1.000 0.843 0.698 0.545 0.576 0.475 0.397 0.333
X6 1.000 0.994 0.908 0.860 0.828 0.786 0.743 0.697
X7 1.000 0.945 0.824 0.726 0.919 0.899 0.699 0.696
Finally, the relevant degree between each child factor and
the mother factor is obtained, as shown in Table 4:
TABLE IV COMPREHENSIVE TOURISM INCOME CORRELATIONDEGREE IN HUANGSHAN DISTRICT
(0,1) (0,2) (0,3) (0,4) (0,5) (0,6) (0,7)
0.7699 0.5602 0.6008 0.7980 0.6085 0.8520 0.8386
By sorting the relevance degree, you can get: Data Processing and Grey Prediction Analysis:
(0,6) >(0,7)>(0,4)>(0,1)>(0,5)>(0,3)>(0,2) This article is to predict and analyze the total tourism
income of Huangshan City. The data adopts the tourism
From the above table and the ranking of relevance, it can comprehensive income of Huangshan City during the period of
be seen that the highest is the correlation of 0.8520 for the total 2009-2016 to carry out digital-analog simulation.
number of visitors received for tourism in the year, followed
by the correlation between the retail sales of social consumer (0) = (168.15 202.1 251 303 314.5 354.4 400.7 450.1)
goods and the total income for tourism is 0.8386. In addition,
the per capita net income of farmers is 0.7980 for tourism First, the raw data array is accumulated and represented as
comprehensive income, and the regional GDP, the total output a sequence of columns (1) .
value of agriculture, forestry, animal husbandry and fishery, (1) = ( 168.15 370.25 621.25 924.25 1238.75 1593.15
investment in fixed assets, and fiscal revenue for tourism
comprehensive income are: 0.7699, 0.6085, 0.6008, 0.5602. 1993.85 2443.95 )
2. Huangshan Tourism Revenue Forecast: Grey Prediction
Model (GM Model)
438