Page 79 - Corporate Finance PDF Final new link
P. 79

BRILLIANT’S                     Fund Flow Statement                                79


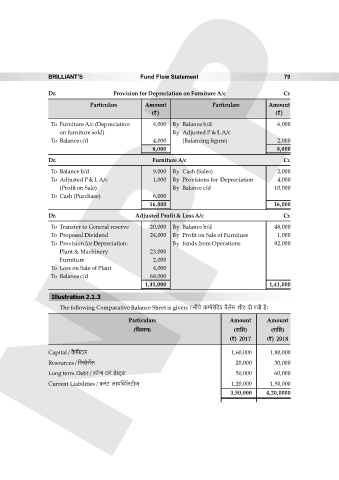
                  Dr.                    Provision for Depreciation on Furniture A/c                 Cr.
                                 Particulars        Amount                  Particulars        Amount
                                                      (`)                                         (`)

                   To Furniture A/c (Depreciation      4,000  By Balance b/d                      6,000
                      on furniture sold)                      By Adjusted P & L A/c
                   To Balance c/d                      4,000     (Balancing figure)               2,000
                                                       8,000                                      8,000

                  Dr.                                  Furniture A/c                                 Cr.
                   To Balance b/d                      9,000  By Cash (Sales)                     2,000
                   To Adjusted P & L A/c               1,000  By Provisions for  Depreciation     4,000
                      (Profit on Sale)                        By Balance c/d                     10,000
                   To Cash (Purchase)                  6,000
                                                      16,000                                     16,000

                                                 Adjusted Profit & Loss A/c
                  Dr.                 NPP                                                            Cr.
                   To Transfer to General reserve     20,000  By Balance b/d                     48,000
                   To Proposed Dividend               24,000  By Profit on Sale of Furniture      1,000
                   To Provision for Depreciation:             By funds from Operations           92,000
                      Plant & Machinery               23,000
                      Furniture                        2,000
                   To Loss on Sale of Plant            4,000
                   To Balance c/d                     68,000
                                                    1,41,000                                    1,41,000
                   Illustration 2.1.3

                      The following Comparative Balance Sheet is given: / ZrMo H$ånoao{Q>d ~¡b|g erQ> Xr J¶r h¡…

                                              Particulars                         Amount       Amount
                                                ({ddaU)                            (am{e)       (am{e)
                                                                                  (`) 2017     (`) 2018
                  Capital / H¡${nQ>b                                              1,60,000      1,80,000

                  Resources / [agmog}g                                              20,000       30,000
                  Long term Debt / bm°ÝJ Q>‘© S>oãQ²>g                              50,000       60,000
                  Current Liabilities / H$a§Q> bm¶{~{bQ>rO                        1,20,000      1,50,000

                                                                                  3,50,000     4,20,0000
   74   75   76   77   78   79   80   81   82   83   84