
Page 38 - Cams Portfolio v3
P. 38
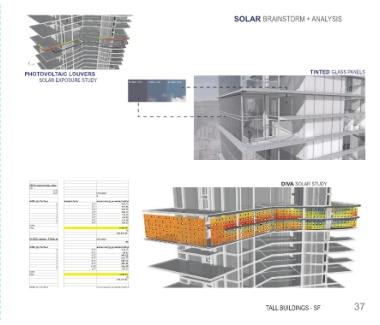
SOLAR BRAINSTORM + ANALYSIS


          PHOTOVOLTAIC LOUVERS                                                                                    TINTED GLASS PANELS
               SOLAR EXPOSURE STUDY


                                                                                              m vision 10% l vision 20% DIVA SOLAR STUDY
                                                PEAK POWER PEAK POWER PEAK POWER PEAK POWER  PEAK POWER PEAK POWER PEAK POWER PEAK POWER
 ONYX photovoltaic glass  ONYX photovoltaic glass  dark  m vision 10% l vision 20%  Xlvision 30%  dark  Xlvision 30%
 mm  x  mm  sqm  mm   x     mm                 sqm
 1245  2456    3057.72  1245      2456             177  1233057.72  104  86                  177  123  104  86
 1675  101     1691.75  1675      101  EFFICIENCY  0.05788626819983520.04022605078293630.03401227058069410.02812553144172781691.75  EFFICIENCY  0.05788626819983520.04022605078293630.03401227058069410.0281255314417278
                                    %           5.788626819983524.022605078293633.401227058069412.81255314417278  %  5.788626819983524.022605078293633.401227058069412.81255314417278
 NODE grp/ Surface  surface area f^2surface area m^2  mean radiation kwh/m^2  cumulated radiation annual  kwh/yrpanel efficiency derated factorNODE grp/ Surface  surface area f^2surface area m^2  me annual energy generated kwh/yran radiation kwh/m^2  cumulated radiation annual  kwh/yrpanel efficiency derated factor  annual energy generated kwh/yr
                                             4705.73
 0  1133  105.259099  1003  105574.876297 0.05788626819983520  1133  105.259099 0.77  1003  105574.876297 0.0578862681998352  0.77  4705.73
                                             1014.06
 1  455  42.270865  916  38720.11234 0.03401227058069411  455  42.270865 0.77  916  38720.11234 0.0340122705806941  0.77  1014.06
 2  503  46.730209  880  41122.58392 0.03401227058069412  503  46.730209 0.77  880  41122.58392 0.0340122705806941  0.77  1076.98
                                             1076.98
 3  510  47.38053  856  40557.73368 0.03401227058069413  510  47.38053 0.77  856  40557.73368 0.0340122705806941  0.77  1062.18
                                             1062.18
 4  455  42.270865  465  19655.952225 0.03401227058069414  455  42.270865 0.77  465 514.78  19655.952225 0.0340122705806941  0.77  514.78
 5  478  44.407634  525  23314.00785 0.03401227058069415  478  44.407634 0.77  525 610.58  23314.00785 0.0340122705806941  0.77  610.58
                                             877
 6  1133  105.259099  877  92312.229823 0.05788626819983526  1133  105.259099 0.77  4114.58  92312.229823 0.0578862681998352  0.77  4114.58
 7  545  50.632135  976  49416.96376 0.03401227058069417  545  50.632135 0.77  1294.20  49416.96376 0.0340122705806941  0.77  1294.20
                                             976
 totals  484.210436  6498  totals 361257.496135  484.210436  6498  361257.496135
 bldg  8715.787848  bldg  total p/ RES floor  8715.787848      14,393.09   total p/ RES floor      14,393.09
                  total PV floors              18           total PV floors              18
                  total power output        259,075.65      total power output       259,075.65
 ECOSOL opaque 110wp panels  ECOSOL opaque 110wp panels  EFFICIENCY           EFFICIENCY
                                               10%                                      10%
 NODE grp/ Surface  surface area f^2surface area m^2  mean radiation kwh/m^2  cumulated radiation annual  kwh/yrpanel efficiencyNODE grp/ Surface  surface area f^2surface area m^2  me annual energy generated kwh/yran radiation kwh/m^2  cumulated radiation annual  kwh/yrpanel efficiency  annual energy generated kwh/yr
                                  0.77
                                             1210.72
 0  123  11.427069  1376  15723.646944  0  0.1  123  11.427069  1376  15723.646944  0.1  0.77  1210.72
                                  0.77
 1  59  5.481277  1642  9000.256834  1  0.1  59  5.481277  1642 900.03  9000.256834  0.1  0.77  900.03
                                  0.77
                                             995.02
 2  99  9.197397  1405  12922.342785  2  0.1  99  9.197397  1405  12922.342785  0.1  0.77  995.02
                                  0.77
                                             244.77
 3  26  2.415478  1316  3178.769048  3  0.1  26  2.415478  1316  3178.769048  0.1  0.77  244.77
                                  0.77
                                             665.64
 4  63  5.852889  1477  8644.717053  4  0.1  63  5.852889  1477  8644.717053  0.1  0.77  665.64
                                  0.77
                                             482.43
 5  40  3.71612  1686  6265.37832  5  0.1  40  3.71612  1686  6265.37832  0.1  0.77    482.43
                                             436.90
                                  0.77
 6  35  3.251605  1745  5674.050725  6  0.1  35  3.251605  1745  5674.050725  0.1  0.77  436.90
 7  123  11.427069  1304  14900.897976  7  0.1  123  11.427069 0.77  1304  14900.897976  0.1  0.77  1147.37
                                             1147.37
 totals  52.768904  11951  totals 61409.161709  52.768904  11951  61409.161709
 bldg  949.840272  bldg  total p/ RES floor  949.840272      6,082.88   total p/ RES floor      6,082.88
                  total PV floors              18           total PV floors              18
                  total power output        109,491.85      total power output       109,491.85
 NODE grp/ Surface  surface area f^2surface area m^2  mean radiation kwh/m^2  cumulated radiation annual  kwh/yrpanel efficiencyNODE grp/ Surface  surface area f^2surface area m^2  me annual energy generated kwh/yran radiation kwh/m^2  cumulated radiation annual  kwh/yrpanel efficiency  annual energy generated kwh/yr
 2  99  9.197397  1405  12922.342785  2  0.1  99  9.197397 0.77  1405 995.02  12922.342785  0.1  0.77  995.02
 3  26  2.415478  1316  3178.769048  3  0.1  26  2.415478 0.77  1316 244.77  3178.769048  0.1  0.77  244.77
 4  63  5.852889  1477  8644.717053  4  0.1  63  5.852889 0.77  1477 665.64  8644.717053  0.1  0.77  665.64
 5  40  3.71612  1686  6265.37832  5  0.1  40  3.71612 0.77  1686 482.43  6265.37832  0.1  0.77  482.43
 6  35  3.251605  1745  5674.050725  6  0.1  35  3.251605 0.77  1745 436.90  5674.050725  0.1  0.77  436.90
 7  123  11.427069  1304  14900.897976  7  0.1  123  11.427069 0.77  1304  14900.897976  0.1  0.77  1147.37
                                             1147.37
 totals  35.860558  8933  totals 36685.257931  35.860558  8933  36685.257931                      TALL BUILDINGS - SF             37
 bldg  645.490044  bldg  total p/ RES floor  645.490044      3,972.13   total p/ RES floor      3,972.13
                  total PV floors              18           total PV floors              18
                  total power output        71,498.41       total power output        71,498.41
 CUMULATIVE  CUMULATIVE  total power output      440,066    total power output         440,066
 bldg gross sq. ft. mixed se pEUI  kbtu/sf annual bldg energy use kbtu/sf  bldg gross sq. ft. mixed se pEUI  kbtu/sf annual bldg energy use kbtu/sf
 615952  70.17     43,221,352   615952  70.17     43,221,352
                  kbtu/yr                   1,501,567       kbtu/yr                   1,501,567
 Annual Gains  energy generated to energy used %  Annual Gains  3.474                   3.474
                                               energy generated to energy used %
                                            39,605.93

 bureau of Labor statistics for SF cost of energy 2017  0.09  bureau of Labor statistics for SF cost of energy 2017  0.09      39,605.93
 EUI  percent of building  program EUI  EUI  percent of building  program EUI
 sml hotel SF  65  0.45  29.25  sml hotel SF  65  0.45  29.25
 mid rise apt  36  0.22  7.92  mid rise apt  36  0.22  7.92
 mixed  100  0.33  33  mixed  100  0.33       33
 1  70.17                          1         70.17
                          1                                         1