
Page 47 - 2016 Annual Report
P. 47
43
43
FINANCIALS | SECTION NAME |
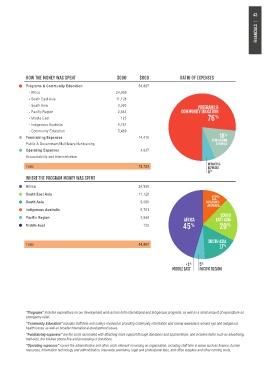
HOW THE MONEY WAS SPENT $000 $000 RATIO OF EXPENSES
Programs & Community Education 54,887
- Africa 24,939
- South East Asia 11,128
- South Asia 9,090 PROGRAMS &
- Pacific Region 2,844 COMMUNITY EDUCATION
- Middle East 125 76 %
- Indigenous Australia 6,761
- Community Education 5,489
Fundraising Expenses 14,410 18 %
FUNDRAISING
Public & Government/Multilateral fundraising EXPENSES
Operating Expenses 4,937
Accountability and Administration
Total 79,723 OPERATING
EXPENSES
6 %
WHERE THE PROGRAM MONEY WAS SPENT
Africa 24,939
South East Asia 11,128
12 %
South Asia 9,090 INDIGENOUS
AUSTRALIA
Indigenous Australia 6,761
SOUTH
Pacific Region 2,844 AFRICA EAST ASIA
Middle East 125 45 % 20 %
SOUTH ASIA
Total 54,887 17 %
<1 % 5 %
MIDDLE EAST PACIFIC REGION
“Programs” includes expenditure on our development work across both international and Indigenous programs, as well as a small amount of expenditure on
emergency relief.
“Community Education” includes staff time and outlays involved in providing community information and raising awareness around eye and Indigenous
health issues as well as broader international development issues.
“Fundraising expenses” are the costs associated with attracting more support through donations and sponsorships, and includes items such as advertising,
mail-outs, the toll-free phone line and processing of donations.
“Operating expenses” covers the administrative and other costs inherent in running an organisation, including staff time in areas such as finance, human
resources, information technology and administration, insurance premiums, legal and professional fees, and office supplies and other running costs.