
Page 52 - OSISA Annual Report 2015-2018
P. 52
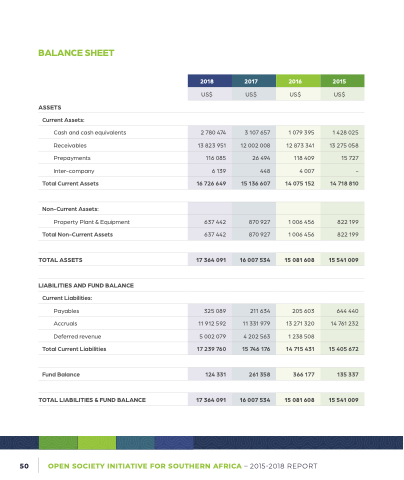
BALANCE SHEET
ASSETS
Current Assets:
Cash and cash equivalents Receivables
Prepayments Inter-company
Total Current Assets
Non-Current Assets:
Property Plant & Equipment
Total Non-Current Assets
TOTAL ASSETS
LIABILITIES AND FUND BALANCE
Current Liabilities:
Payables Accruals Deferred revenue
Total Current Liabilities
Fund Balance
TOTAL LIABILITIES & FUND BALANCE
 2018
  2017
  2016
  2015
 US$
 US$
 US$
 US$
         2 780 474
 3 107 657
 1 079 395
 1 428 025
 13 823 951
  12 002 008
  12 873 341
  13 275 058
 116 085
26 494
118 409
15 727
 6 139
  448
  4 007
  -
 16 726 649
 15 136 607
 14 075 152
 14 718 810
            637 442
  870 927
  1 006 456
  822 199
 637 442
 870 927
 1 006 456
 822 199
      17 364 091
  16 007 534
  15 081 608
  15 541 009
        325 089
  211 634
  205 603
  644 440
 11 912 592
11 331 979
13 271 320
14 761 232
 5 002 079
  4 202 563
  1 238 508
   17 239 760
 15 746 176
 14 715 431
 15 405 672
       124 331
  261 358
  366 177
  135 337
    17 364 091
  16 007 534
  15 081 608
  15 541 009
      50
OPEN SOCIETY INITIATIVE FOR SOUTHERN AFRICA – 2015-2018 REPORT
