
Page 53 - OSISA Annual Report 2015-2018
P. 53
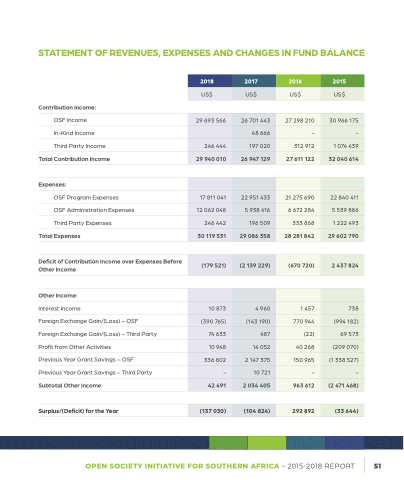
STATEMENT OF REVENUES, EXPENSES AND CHANGES IN FUND BALANCE
Contribution Income:
OSF Income In-Kind Income Third Party Income
Total Contribution Income
Expenses:
OSF Program Expenses
OSF Administration Expenses Third Party Expenses
Total Expenses
Deficit of Contribution Income over Expenses Before Other Income
Other Income:
Interest Income
Foreign Exchange Gain/(Loss) – OSF Foreign Exchange Gain/(Loss) – Third Party Profit from Other Activities
Previous Year Grant Savings – OSF Previous Year Grant Savings – Third Party Subtotal Other Income
Surplus/(Deficit) for the Year
 2018
  2017
  2016
  2015
 US$
 US$
 US$
 US$
       29 693 566
  26 701 443
  27 298 210
  30 966 175
 48 666
-
-
 246 444
 197 020
 312 912
 1 074 439
 29 940 010
  26 947 129
  27 611 122
  32 040 614
           17 811 041
 22 951 433
 21 275 690
 22 840 411
 12 062 048
  5 938 416
  6 672 284
  5 539 886
 246 442
196 509
333 868
1 222 493
 30 119 531
  29 086 358
  28 281 842
  29 602 790
        (179 521)
  (2 139 229)
  (670 720)
  2 437 824
        10 873
  4 960
  1 457
  738
 (390 765)
(143 190)
770 944
(994 182)
 74 633
 487
 (22)
 69 573
 10 948
 14 052
 40 268
 (209 070)
 336 802
  2 147 375
  150 965
  (1 338 527)
 -
10 721
-
-
 42 491
  2 034 405
  963 612
  (2 471 468)
           (137 030)
  (104 824)
  292 892
  (33 644)
      OPEN SOCIETY INITIATIVE FOR SOUTHERN AFRICA – 2015-2018 REPORT
51
