
Page 64 - ro membanes
P. 64
3.3 TYPICAL DIAGNOSTICS PROCEDURES
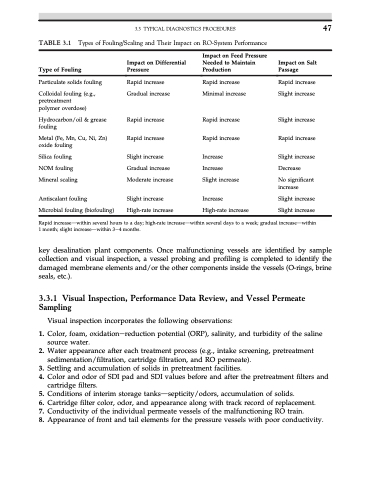
TABLE 3.1 Types of Fouling/Scaling and Their Impact on RO-System Performance
47
Type of Fouling
Particulate solids fouling
Colloidal fouling (e.g., pretreatment
polymer overdose)
Hydrocarbon/oil & grease fouling
Metal (Fe, Mn, Cu, Ni, Zn) oxide fouling
Silica fouling NOM fouling Mineral scaling
Antiscalant fouling
Microbial fouling (biofouling)
Impact on Differential Pressure
Rapid increase Gradual increase
Rapid increase
Rapid increase
Slight increase Gradual increase Moderate increase
Slight increase
Impact on Feed Pressure Needed to Maintain Production
Rapid increase Minimal increase
Rapid increase
Rapid increase
Increase Increase
Slight increase
Increase
Impact on Salt Passage
Rapid increase Slight increase
Slight increase
Rapid increase
Slight increase Decrease
No significant increase
Slight increase
High-rate increase
Rapid increasedwithin several hours to a day; high-rate increasedwithin several days to a week; gradual increasedwithin
key desalination plant components. Once malfunctioning vessels are identified by sample collection and visual inspection, a vessel probing and profiling is completed to identify the damaged membrane elements and/or the other components inside the vessels (O-rings, brine seals, etc.).
3.3.1 Visual Inspection, Performance Data Review, and Vessel Permeate Sampling
Visual inspection incorporates the following observations:
1. Color, foam, oxidationereduction potential (ORP), salinity, and turbidity of the saline source water.
2. Water appearance after each treatment process (e.g., intake screening, pretreatment sedimentation/filtration, cartridge filtration, and RO permeate).
3. Settling and accumulation of solids in pretreatment facilities.
4. Color and odor of SDI pad and SDI values before and after the pretreatment filters and
cartridge filters.
5. Conditions of interim storage tanksdsepticity/odors, accumulation of solids.
6. Cartridge filter color, odor, and appearance along with track record of replacement.
7. Conductivity of the individual permeate vessels of the malfunctioning RO train.
8. Appearance of front and tail elements for the pressure vessels with poor conductivity.
High-rate increase
Slight increase
1 month; slight increasedwithin 3e4 months.
