
Page 287 - 2020 Angels Media Guide
P. 287
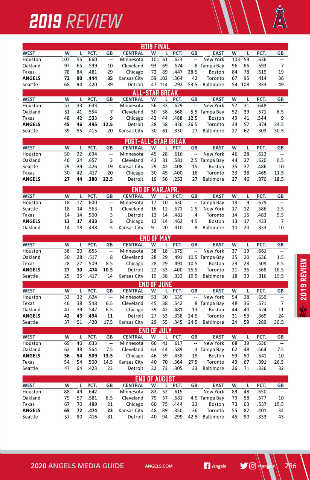
2019 REVIEW
2019 Final
W
G
G
W
C
WEST EST
W W L L PCT. PCT. G GB B CENTRAL ENTRAL W L L PCT. PCT. GB B E EAST W AST W L L P PCT. CT. GBB
Houston ouston 1 107 07 5 55 .660 5 .660 -- -- M 101 61 .623 01 61 .623 -- New York - New York 103 59 03 59 . .636 636 -- --
H
-
1
Minnesota innesota
1
Oakland akland 9 97 7 65 .5995 .599 1 10 0 C Cleveland leveland 93 69 .574 3 69 .574 8 8 Tampa Bay Tampa Bay 96 66 6 66 . .593 593 7 7
O
9
9
6
7
7
B
1
T Texasexas 788 8 844 . .481481 299 C Chicagohicago 722 899 . .447447 2 28 .58 .5 Bostonoston 8 844 7 788 . .519519 199
8
2
T
A ANGELS NGELS 72 2 9 90 .4440 .444 35 35 Kansas City Kansas City 59 103 .364 103 .364 4 42 2 Toronto oronto 67 95 7 95 . .414 414 36 36
6
7
59
5
.
B
4
1
9
.
S Seattleeattle 6 688 944 .420420 3 399 D Detroitetroit 477 1 11414 .292292 53 .53 .5 Baltimorealtimore 544 10808 . .333333 4 499
5
All-Star Break
WEST EST W L L PCT. PCT. GB B C CENTRAL ENTRAL W L L PCT. PCT. G GB B EAST W AST W L L PCT. CT. GBB
W
W
G
G
E
W
P
3
.
M
H Houston ouston 5 57 7 33 .633 3 .633 -- -- Minnesota innesota 5 56 33 .629 6 33 .629 - -- New York - New York 5 57 7 3 31 1 .648 648 -- --
5
Oakland akland 5 51 1 4 41 .554 1 .554 7 7 C Cleveland leveland 50 38 .568 0 38 .568 5.5 Tampa Bay .5 Tampa Bay 52 39 2 39 . .571 571 6 6.5.5
5
O
5
B
4
4
C
T
Texasexas 488 422 . .533533 9 9 Chicagohicago 422 444 . .488488 12 .52 .5 Bostonoston 499 411 . .544544 9 9
4
4
4
4
1
.
A
ANGELS NGELS 4 45 5 46 .495 12.56 .495 12.5 D Detroitetroit 2 288 588 .326326 26 .56 .5 T Torontooronto 3 344 5 577 .374374 2 24 .54 .5
5
4
2
.
3
Seattle eattle 3 39 9 55 .415 5 .415 2 20 Kansas City 0 Kansas City 30 61 .330 0 61 .330 27 Baltimore 7 Baltimore 2 27 62 7 62 . .303 303 30.50.5
S
3
2
5
Post-All-Star Break
E
W
G
W
G
G
W W L L PCT. PCT. GB B C CENTRAL ENTRAL W L L PCT. PCT. GB B EAST W AST W L L P PCT. CT. GBB
WEST EST
4
H Houston ouston 5 50 0 2 22 .694 2 .694 -- -- Minnesota innesota 45 28 .616 5 28 .616 - -- New York 46 28 - New York 46 28 . .622 622 -- --
M
Oakland akland 46 6 2 24 .657 4 .657 3 3 C Cleveland leveland 4 43 31 .581 3 31 .581 2 2.5 Tampa Bay .5 Tampa Bay 4 44 27 4 27 . .620 620 0 0.5.5
O
4
S Seattle eattle 2 29 9 3 39 .426 9 .426 19 Kansas City 9 Kansas City 2 29 42 .408 9 42 .408 1 15 5 Boston oston 35 37 5 37 . .486 486 10 10
1
B
3
.
.
2
4
1
3
T
Texasexas 300 422 .417417 200 C Chicagohicago 3 300 4 455 .400400 1 166 T Torontooronto 3 333 3 388 . .465465 11 .51 .5
D
1
A ANGELS NGELS 2 27 7 4 44 .380 22.54 .380 22.5 Detroitetroit 1 199 566 .253253 2 277 B Baltimorealtimore 277 4 466 . .370370 18 .58 .5
5
2
.
End of MAR ./Apr .
WEST EST W L L PCT. PCT. GB B CENTRAL ENTRAL W L L PCT. PCT. GB B E EAST W AST W L L PCT. CT. G GBB
W
P
W
C
G
G
W
Minnesota innesota
H
-
1
Houston ouston 1 18 8 1 12 .600 2 .600 -- -- M 1 17 10 .630 7 10 .630 -- Tampa Bay - Tampa Bay 19 9 9 9 . .679 679 -- --
C
1
1
.
2
S Seattle eattle 1 18 8 1 14 .563 4 .563 1 1 Cleveland leveland 1 16 12 .571 6 12 .571 1.5 New York .5 New York 1 17 7 12 2 .586 586 2.5.5
1
T
1
1
D
Texasexas 144 144 . .500500 3 3 Detroitetroit 1 133 144 .481481 4 4 Torontooronto 1 144 1 155 . .483483 5 .5 .5
T
5
.
.
4
1
A ANGELS NGELS 13 3 1 17 .433 7 .433 5 5 Chicagohicago 1 122 144 .462462 4 .5 .5 B Bostonoston 133 177 . .433433 7 7
1
C
1
1
5
1
O
2
Oakland akland 1 14 4 18 .438 8 .438 5 Kansas City Kansas City 9 9 20 .310 0 .310 9 9 Baltimore Baltimore 1 10 20 0 20 . .333 333 10 10
End of May
WEST EST
W
W
G
L
W W L L PCT. PCT. G GB B C CENTRAL ENTRAL W L PCT. PCT. GB B E EAST W AST W L L P PCT. CT. G GBB
3
H Houston ouston 38 8 2 20 .655 0 .655 -- -- Minnesota innesota 38 18 .679 8 18 .679 - -- New York - New York 37 19 7 19 . .661 661 -- --
3
3
M
3
2
3
O Oakland akland 30 0 2 28 .517 8 .517 8 8 Cleveland leveland 28 29 .491 10.5 Tampa Bay 8 29 .491 10.5 Tampa Bay 35 20 5 20 . .636 636 1 1.5.5
C
1
2
2
T Texasexas 288 2 277 . .509509 8 8 .5 .5 C Chicagohicago 288 2 299 . .491491 10 .50 .5 B Bostonoston 2 299 2 288 . .509509 8 8 .5 .5
2
A ANGELS NGELS 2 27 7 3 30 .474 10.50 .474 10.5 D Detroitetroit 222 3 333 .400400 15 .55 .5 Torontooronto 2 211 3 366 .368368 1 16 .56 .5
T
.
.
1
2
1
S Seattle eattle 25 5 3 35 .417 5 .417 1 14 Kansas City 4 Kansas City 1 19 38 .333 19.5 Baltimore 9 38 .333 19.5 Baltimore 18 39 8 39 . .316 316 19.59.5
1
End of June 2019 review
G
L
C
W W L PCT. PCT. GB B CENTRAL ENTRAL W L L PCT. PCT. G GB B E EAST W AST W L L P PCT. CT. GBB
W
W
WEST EST
G
3
-
H Houston ouston 5 53 3 32 .624 2 .624 -- -- Minnesota innesota 5 53 30 .639 3 30 .639 -- New York - New York 5 54 28 4 28 . .659 659 -- --
M
T Texas exas 46 6 3 38 .548 8 .548 6.5 .5 Cleveland leveland 45 38 .542 5 38 .542 8 Tampa Bay Tampa Bay 4 48 36 8 36 . .571 571 7 7
8
6
C
4
4
6
O
Oaklandakland 477 399 . .547547 6 .5 .5 C Chicagohicago 3 399 422 . .481481 1 133 B Bostonoston 4 444 4 400 .524524 1 111
3
4
4
.
2
.
5
A
4
ANGELS NGELS 42 2 43 .494 3 .494 11 11 D Detroitetroit 2 277 5 533 . .338338 24 .54 .5 T Torontooronto 311 533 .369369 2 244
4
3
59
.
1
5
S
Seattle eattle 3 37 7 51 .420 1 .420 17.5 Kansas City 7.5 Kansas City 2 29 55 .345 24.5 Baltimore 9 55 .345 24.5 Baltimore 2 24 4 59 .289 289 3 30.50.5
End of July
W W L PCT. PCT. GB B C CENTRAL ENTRAL W L L PCT. PCT. GB B EAST W AST W L L P PCT. CT. GBB
W
WEST EST
L
E
G
G
G
W
.
M
H Houston ouston 6 69 9 4 40 .633 0 .633 -- -- Minnesota innesota 6 66 41 .617 6 41 .617 - -- New York - New York 68 39 8 39 .636 636 -- --
6
6
4
7
3
O
.
6
Oakland akland 62 2 48 .564 8 .564 7 7.5 .5 C Cleveland leveland 6 63 44 .589 3 44 .589 3 Tampa Bay Tampa Bay 62 48 2 48 .564 564 7.5.5
59
5
A ANGELS NGELS 56 6 5 54 .509 13.54 .509 13.5 C Chicagohicago 466 59 .438438 1 199 B Bostonoston 59 5 500 . .541541 1 100
59
.
4
4
5
T Texas exas 54 4 54 .500 14.5 Kansas City 4 .500 14.5 Kansas City 4 40 70 .364 27.5 0 70 .364 27.5 T Toronto oronto 43 67 3 67 .391 391 2 26.56.5
.
5
7
6
3
71
3
Seattleeattle 477 644 . .423423 233 D Detroitetroit 3 322 733 . .305305 333 B Baltimorealtimore 3 366 71 .336336 322
S
4
.
2
End of August
G
P
W
L
G
G
C
W
WEST EST
E
W W L L PCT. PCT. GB B CENTRAL ENTRAL W L PCT. PCT. GB B EAST W AST W L L PCT. CT. GBB
8
.
M
8
-
H Houston ouston 8 88 8 4 49 .642 9 .642 -- -- Minnesota innesota 83 52 .615 3 52 .615 -- New York - New York 89 48 9 48 .650 650 -- --
C
O Oakland akland 79 9 57 .581 7 .581 8 8.5 .5 Cleveland leveland 7 79 57 .581 9 57 .581 4 4.5 Tampa Bay .5 Tampa Bay 7 79 58 9 58 . .577 577 10 10
5
7
T Texasexas 6 677 7 700 . .489489 211 Chicagohicago 6 600 755 .444444 233 Bostonoston 7 733 633 .537537 1 15 .55 .5
.
.
7
6
B
2
C
2
.
5
A ANGELS NGELS 6 65 5 72 .474 2 .474 23 23 Kansas City Kansas City 48 89 .350 8 89 .350 3 36 6 T Toronto oronto 55 82 5 82 .401 401 3 34 4
4
7
3
B
.
8
.
S Seattleeattle 577 800 .416416 311 D Detroitetroit 4 400 9 944 . .299299 4 42 .52 .5 Baltimorealtimore 4 455 9 900 .333333 4 433
5
2020 ANGELS MEDIA GUIDE ANGELS.COM /angels @angels 286