
Page 5 - VB Economic Development Action Plan_Final
P. 5
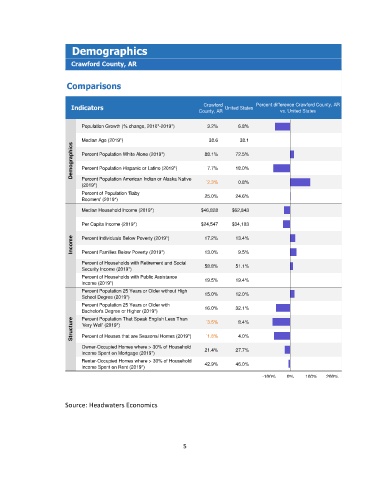
Demographics

                         Crawford County, AR


                       Comparisons


                         Indicators                                 Crawford  United States  Percent difference Crawford County, AR
                                                                   County, AR                 vs. United States


                            Population Growth (% change, 2010*-2019*)  3.2%     6.8%
                            Median Age (2019*)                        38.6      38.1
                         Demographics  Percent Population White Alone (2019*)  88.1%  72.5%


                            Percent Population Hispanic or Latino (2019*)
                                                                      7.7%
                                                                               18.0%
                            Percent Population American Indian or Alaska Native
                            (2019*)                                  ˙2.3%      0.8%
                            Percent of Population 'Baby              25.0%     24.6%
                            Boomers' (2019*)

                            Median Household Income (2019*)         $46,828   $62,843

                            Per Capita Income (2019*)               $24,547   $34,103
                         Income  Percent Individuals Below Poverty (2019*)  17.2%  13.4%


                                                                                9.5%
                            Percent Families Below Poverty (2019*)
                                                                     13.0%
                            Percent of Households with Retirement and Social
                            Security Income (2019*)                  58.8%     51.1%
                            Percent of Households with Public Assistance
                            Income (2019*)                           19.5%     19.4%
                            Percent Population 25 Years or Older without High
                            School Degree (2019*)                    15.0%     12.0%
                            Percent Population 25 Years or Older with   16.0%  32.1%
                            Bachelor's Degree or Higher (2019*)
                            Percent Population That Speak English Less Than
                         Structure  'Very Well' (2019*)              ˙3.5%      8.4%

                                                                                4.0%
                                                                     ˙1.8%
                            Percent of Houses that are Seasonal Homes (2019*)
                            Owner-Occupied Homes where > 30% of Household   21.4%  27.7%
                            Income Spent on Mortgage (2019*)
                            Renter-Occupied Homes where > 30% of Household   42.9%  46.0%
                            Income Spent on Rent (2019*)
                                                                                        -100%   0%    100%   200%


                       Source: Headwaters Economics


                                                              5