
Page 143 - Algebra 1
P. 143
A double-bar graph shows groups of two bars side by side. This allows easier comparison of two related sets of data.
Interpreting Double-Bar Graphs
Example
1
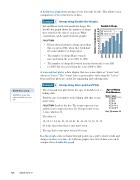
Sal and Harry both own sandwich shops. The double-bar graph shows the number of shops they owned at the end of each year. What conclusions can be made from the graph?
SOLUTION
• Harry always had more shops open than Sal, except in 2004, when they both had the same number of shops open.
• The number of shops Harry owned increased from the years 2001 to 2006.
Sandwich Shops
20 18 16 14 12 10
8 6 4 2 0
Sal’s Deli Harry’s Deli
• The number of shops Sal owned increased from the years 2001 to 2004, but decreased from the years 2004 to 2006.
A stem-and-leaf plot is a data display that uses some digits as "stems" and others as "leaves." The "stems" have a greater place value than the "leaves." Stem-and-leaf plots are useful for organizing and ordering data.
Interpreting Stem-and-Leaf Plots
The stem-and-leaf plot shows the ages of members of a hiking club.
Find the age of members at the hiking club that occurs most often.
SOLUTION Look at the key. The stems represent tens and the leaves represent ones. So 3|2 represents 3 tens 2 ones, which is 32.
The data set:
10, 10, 17, 24, 26, 32, 33, 34, 41, 41, 41, 43, 53, 56, 56, 59 41 is the data value that occurs most often.
The age that occurs most often is 41 years.
Age of Hiking Club Members
Example
2
Math Reasoning
Verify How many data values should be in your list?
128 Saxon Algebra 1
In a line graph, a line is drawn through points on a grid to show trends and changes in data over time. As with bar graphs, two related data sets can be compared in a double-line graph.
Stem
1 2 2 3 4 4 5
Leaf
0 0 7
4 46 6
2 3 4
1 11 1 1 1 3 3 6 6 9
Key: 1|0 means 10
2001 2002 2003 2004 2005 2006
Number of Sandwich Shops
