
Page 146 - Algebra 1
P. 146
Practice Distributed and Integrated
*1. True or False: A stem-and-leaf plot can help analyze change over time. If false, (22) explain why.
2. Complete the table for y = -3x - 9. (20)
3. Simplify 2p(xy - 3k). (15)
x
-1
0
1
y
4. Solvey-3=2. (19)
*5. Solvex-_1 =_7.
8
*8. Choose an appropriate graph to display the change in profit of a company over
(22) several years. Explain your choice.
9. Verify Determine whether each statement below is true or false. If false, provide a (1) counterexample.
a. The set of integers is closed under division.
b. The set of irrational numbers is closed under division.
c. The set of integers is closed under addition.
*10. Racing The table shows the Indianapolis 500 fastest lap times to the nearest (22) second, every 5 years since 1960. Make an appropriate graph to display the
data. Then make a conclusion about the data.
Fastest Lap Times in the Indianapolis 500
11. Graph the ordered pair (-4, -1) on a coordinate plane. (20)
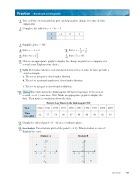
12. Error Analysis Two students plotted the point (-4, 3). Which student is correct? (20) Explain the error.
6. Solve 4x = 2_2. (21) 3
(21)
(19) 4
7. Solve 7x = 49.
Year
1960
1965
1970
1975
1980
1985
1990
1995
2000
2005
Time (seconds)
62
57
54
48
47
44
40
40
41
39
Student A
Student B
4
y
2
O
x
-4
-2
2
4
-2
-4
Lesson 22 131
4 2
y
O
x
-4-2 24 -2
-4
