
Page 192 - Algebra 1
P. 192
2L A B
Creating a Table
Graphing Calculator Lab (Use with Lesson 30)
An equation describes a relationship between two quantities. Sometimes it is inconvenient to calculate a large quantity of outputs by substituting given values into the equation. Instead, use your graphing calculator to quickly make a table of values.
Find the value of y for the equation y = 3x + 5 when x = 15, 45, 75, 105, and 135.
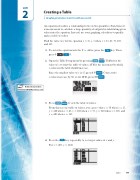
1. To enter the equation into the Y = editor, press the key. Then press 3 5.
2. Open the Table Setup menu by pressing . TblStart is the value of x to start the table of values. ΔTbl is the increment by which
x-values in the table should increase.
Since the smallest value of x is 15, press 1 5
x-values increase by 30, so for ΔTbl, press 3 0
3. Press to view the table of values.
. Consecutive .
Online Connection www.SaxonMathResources.com
From this screen’s table of values, you can see that y = 50 when x = 15, y = 140 when x = 45, y = 230 when x = 75, y = 320 when x = 105, and y = 410 when x = 135.
4. Press the key repeatedly to see larger values of x and y, For x = 405, y = 1220.
Lab 2 177
