
Page 194 - Algebra 1
P. 194
L E S S O N Graphing Functions 30
Warm Up
1. Vocabulary A (relation, function) is a set of ordered pairs where
(25)
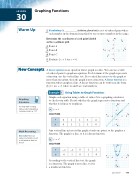
Determine the coordinates of each point labeled on the coordinate grid.
2. Point A (20)
3. Point B (20)
4. Point C (20)
5. Evaluate 2x + 3 for x = 4. (9)
A linear equation is an equation whose graph is a line. You can use a table of ordered pairs to graph an equation. To determine if the graph represents a function, use the vertical line test. If a vertical line intersects the graph at more than one point, then the graph is not a function. A linear function is a function whose graph is a line. A linear function can be written in the form f(x) = mx + b, where m and b are real numbers.
Using Tables to Graph Functions
Graph each equation using a table of values. Use a graphing calculator to check your table. Decide whether the graph represents a function and whether it is linear or nonlinear.
a. y=x SOLUTION
Any vertical line intersects this graph at only one point, so the graph is a function. The graph is a line, so it is a linear function.
b. y=x2 SOLUTION
According to the vertical line test, the graph is a function. The graph is not a line, so it is a nonlinear function.
each number in the domain is matched to one or more numbers in the range.
y
4
B
A
2
O
x
-4
-2
2
4
C
-2
-4
New Concepts
Example
1
Graphing Calculator
For help with creating tables, refer to Graphing Calculator Lab 2, p. 177.
8
y
4
O
x
-8
-4
4
8
-4
-8
x
0
1
2
3
4
y
0
1
2
3
4
Math Reasoning
Generalize How can values in a table be used to tell whether data are linear?
y
8
x
-2
-1
0
1
2
y
4
1
0
1
4
4
x
-8
-4
Lesson 30 179
4
8
-4
-8
