
Page 233 - Algebra 1
P. 233
An efficient method for graphing a linear equation in two variables is to plot the x- and y-intercepts and then to draw a line through them.
Graphing Using the x- and y-Intercepts Graph 5x - 6y = 30 using the x- and y-intercepts.
SOLUTION
To find the intercepts, make a table. Substitute 0 for y and solve for x. Substitute 0 for x and solve for y.
5x - 6y = 30 5x - 6y = 30 5x-6(0)=30 5(0) - 6y = 30 5x = 30 -6y = 30
5x = 30 -6y = 30 __ __
55 -6 -6 x=6 y = -5
The x-intercept is 6. The y-intercept is -5.
To graph the equation, plot the points (6, 0) and (0, -5). Then draw a line
through them.
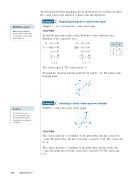
Locating x- and y-Intercepts on a Graph Find the x- and y-intercepts on the graph.
SOLUTION
The x-intercept is the x-coordinate of the point where the line crosses the x-axis. The point where the line crosses the x-axis is (-4, 0). The x-intercept is -4.
The y-intercept is the y-coordinate of the point where the line crosses the y-axis. The point where the line crosses the y-axis is (0, 7). The y-intercept is 7.
Example
2
Math Reasoning
Write Explain why the y-value of the x-intercept is 0 and the x-value of the y-intercept is 0.
x
y
6
0
0
-5
O
y
x
8
-4
-8
Example
3
Caution
The interval used on the x- and y-axis varies. Check the labels before naming the coordinates of a point.
y
4
O
x
-8
218 Saxon Algebra 1
