
Page 420 - Algebra 1
P. 420
6. Press to view the histogram in the new window.
7. Use and then use the and keys to view the statistical values. The “min=” and
“max<” provide minimum and maximum
values for each interval. The “n=” gives the number of test scores in the interval.
One student earned a score in the 70’s, five students earned a score in the 80’s, and three earned a score of at least 90 points. Therefore, of the 18 students, nine earned a score above 70 points on the test.
Lab Practice
The data list the results of a words-per-minute typing test.
39, 41, 42, 47, 47, 50, 53, 55, 55, 57, 60, 62, 64, 68, 70, 71
a. Use a graphing calculator to make a histogram of the data using intervals of
5 words per minute.
b. According to the data, how many people type between 55 and 65 words per minute?
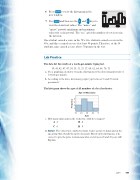
The histogram shows the ages of all members of a local orchestra.
Age of Musicians
8 6 4 2
10 20 30 40 50
Ages
c. How many musicians in the orchestra could be teenagers? A2 B4
C6 D8
d. Analyze The orchestra’s conductor wants to give a prize to musicians in the age group that attends the most rehearsals. Based on the histogram, is he correct to give the prize to musicians who are between 20 and 29 years old? Explain.
Lab 6 405
Frequency
