
Page 424 - Algebra 1
P. 424
Lesson Practice
a. The list shows the low temperatures in degrees Fahrenheit in New
(Ex 1)
65, 70, 69, 61, 56, 52, 43, 42, 51, 60, 63, 52, 60, 54, 50 b. Create a histogram of the data in problem a.
(Ex 3)
c. Use the stem-and-leaf plot to find the median, mode, and range of the
(Ex 2)
Key: 5 6 = 56°F
d. Use the stem-and-leaf plot in problem c to find the relative frequency
(Ex 2)
of 64.
e. Create a histogram of the data in problem c using a graphing calculator.
(Ex 4)
Distributed and Integrated
Orleans for the first 15 days of April 2007. Create a stem-and-leaf plot of the data.
low temperatures the last 15 days of April 2007 in New Orleans, LA.
Low Temperatures (°F) Last 15 Days April 2007 for New Orleans, LA
Stem Leaves
45
5 4, 6, 7, 8, 9, 9
6 0, 3, 3, 4, 4, 8, 8
71
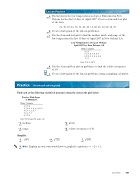
Practice
Find each of the following statistical measures using the data in the plot below.
Service Club Ages of Members
Stem Leaves
2 5, 6
3 0, 2, 3, 4, 4, 4, 8, 9
4 1, 1, 2, 6, 7
5 2, 5, 7
6 0, 4
Key: 5 6 means 56 years old
*1. median (62)
*3. range (62)
Simplify. 5. √ 88
(61)
*6. √ 72 0 (61)
*2. mode (62)
*4. relative frequency of 41 (62)
7. √ 18 0 (60)
8. Write Explain in your own words how to graph the equation y = -_1 x + 2. (49) 3
Lesson 62 409
