
Page 825 - Algebra 1
P. 825
Example
1
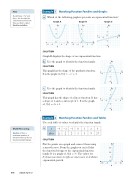
Matching Function Families and Graphs
a. Which of the following graphs represents an exponential function? Graph A Graph B Graph C
Hint
Recall that y = 6x2 and f(x) = 6x2 describe the same function. The form that uses f(x) is called function notation.
y
6
4
O
x
-4
-2
2
4
y
6
4
O
x
-4
-2
2
4
2
O
x
-4
4
SOLUTION
Graph B displays the shape of an exponential function.
b. Use the graph to identify the function family.
SOLUTION
This graph has the shape of the quadratic function. Itisthegraphof f(x)=-x2 +3.
c. Use the graph to identify the function family.
SOLUTION
This graph has the shape of a linear function. It has a slope of 2 and a y-intercept of 1. It is the graph
of f(x)=2x+1.
Matching Function Families and Tables
Use each table of values to identify the function family.
a.
SOLUTION
Plot the points on a graph and connect them using a smooth curve. From the graph you can tell that the function belongs to the exponential function family. It is a graph of f(x) = 3x. The values for f(x) increase more steeply as x increases, so it shows exponential growth.
-4
4
-2
-4
y
4
O
2
x
-4
-2
2
4
-2
-4
Example
2
x
-3
-2
-1
0
1
2
3
f (x)
_1 27
_1 9
_1 3
1
3
9
27
Math Reasoning
Analyze Is there a maximum number of functions that can be in a function family? Explain.
y
24
16
8
O
x
810 Saxon Algebra 1
-16
-
4
8
y
-2
-2
-4
y
4
2
O
8
1
6
x
