
Page 826 - Algebra 1
P. 826
x
-3
-2
-1
0
1
2
3
f (x)
8
3
0
-1
0
3
8
b.
SOLUTION
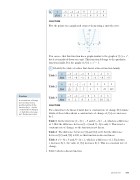
Plot the points on a graph and connect them using a smooth curve.
y
4
2
O
x
-4
-2
2
4
-2
You can see that this function has a graph similar to the graph of f (x) = x2, but it is translated down one unit. This function belongs to the quadratic function family. It is the graph of f (x) = x2 - 1.
c. Identify the table of values that shows a linear function family. Table 1
Table 2
Table 3
SOLUTION
For a function to be linear, it must have a constant rate of change. Determine which of these tables shows a constant rate of change of f (x) as x increases by 1.
Table1: Inthefirstrow,f(-3)=-9andf(-2)=-4,whichisadifference of 5. But the difference between f (-2) and f (-1) is only 3. This is not a constant rate of change, so the function is not linear.
Table2: Thedifferencebetweenf(1)andf(2)is20,butthedifference between f (2) and f (3) is 100, so this function is also not linear.
Table 3: f (-3) = 0 and f (-2) = 2, which is a difference of 2. Each time x increases by 1, the value of f(x) increases by 2. This is a constant rate of change.
Table 3 shows a linear function.
x
-3
-2
-1
0
1
2
3
f (x)
-9
-4
-1
0
-1
-4
-9
x
-3
-2
-1
0
1
2
3
f (x)
_1 125
_1 25
_1 5
1
5
25
125
x
-3
-2
-1
0
1
2
3
f (x)
0
2
4
6
8
10
12
Caution
A constant rate of change does not have to be a positive number. In the function f(x) = -3x, the constant rate of change is -3. Each time x increases by 1, f(x) decreases by 3.
Lesson 119 811
