
Page 855 - Algebra 1
P. 855
APPENDIX
4S S O N Using Variation and Standard Deviation
New Concepts
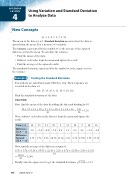
{1, 2, 3, 4, 5, 6, 7, 8, 9}
The mean of the data set is 5. Standard deviation measures how the data is
spread from the mean. It is a measure of variation.
The variance, represented by the symbol σ2, is the average of the squared differences from the mean. To calculate the variance.
• Find the mean of the data.
• Subtract each value from the mean and square the result. • Find the average of the squared results.
The standard deviation, represented by the symbol σ, is the square root of the variance.
Finding the Standard Deviation
Ten students are asked how many CDs they own. Their responses are recorded in the data set.
{10, 15, 13, 20, 8, 11, 10, 9, 14, 16} Find the standard deviation of the data.
SOLUTION
LE
to Analyze Data
Example
1
First, find the mean of the data by adding the data and dividing by 10.
10+15+13+20+8+11+10+9+14+16 = 126 =12.6 ______
10 10
Next, subtract each value in the data set from the mean and square the result.
Value (x)
10
15
13
20
8
11
10
9
14
16
Difference (12.6 - x)
2.6
-2.4
-0.4
-7.4
4.6
1.6
2.6
3.6
-1.4
-3.4
Difference Squared (12.6 - x)2
6.76
5.76
0.16
54.76
21.16
2.56
6.76
12.96
1.96
11.56
Now, find the average of the differences squared.
6.76 + 5.76 + 0.16 + 54.76 + 21.16 + 2.56 + 6.76 + 12.96 + 1.96 + 11.56 __ _ _ _ _ _ _
10
Finally, take the square root to get the standard deviation. √1 2. 44 ≈ 3.53
= 124.4 = 12.44. 10
840
Saxon Algebra 1
