
Page 856 - Algebra 1
P. 856
The standard deviation describes the spread of the data. When the standard deviation is low, the data tends to be close to the measure of central tendency, or mean. When the standard deviation is high, the data is more spread out.
An outlier is a number that is much greater or much less than the other values in the data set. Outliers have a great impact on the mean and standard deviation and can cause them to misrepresent the data set. One way to determine whether a value is an outlier is to see if it is more than 3 standard deviations from the mean.
Examining Outliers
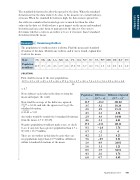
The population of southern states is shown. Find the mean and standard deviation of the data. Identify any outliers, and if one is found, explain how it affects the mean.
SOLUTION
Example
2
State
TX
OK
AK
LA
MS
AL
FL
GA
NC
SC
VA
WV
MD
DE
KY
TN
Population in millions
22.9
3.5
2.8
4.5
2.9
4.6
17.8
9.1
8.7
4.2
7.6
1.8
5.6
0.8
4.1
6.0
22.9 + 3.5 + 2.8 + 4.5 + 2.9 + 4.6 + 17.8 + 9.1 + 8.7 + 4.2 + 7.6 + 1.8 + 5.6 + 0.8 + 4.1 + 6.0 _________
16
≈ 6.7
Next, subtract each value in the data set from the
mean and square the result.
First, find the mean of the state populations.
Population
x
Difference (6.7 - x)
Difference Squared (6.7 - x)2
22.9
-16.2
262.44
3.5
3.2
10.24
2.8
3.9
15.21
4.5
2.2
4.84
2.9
3.8
14.44
4.6
2.1
4.41
17.8
-11.1
123.21
9.1
-2.4
5.76
8.7
-2
4
4.2
2.5
6.25
7.6
-0.9
0.81
1.8
4.9
24.01
5.6
1.1
1.21
0.8
5.9
34.81
4.1
2.6
6.76
6.0
0.7
0.49
Now, find the average of the difference squared,
518.89
_16
standard deviation.
≈ 32.43, and take the square root to get the √ 3 2 . 4 3 ≈ 5 . 6 9
An outlier would be outside the 3 standard deviations from the mean, 6.7 ± 3(5.69).
Negative population would not make sense, so check to see if any state has a greater population than 6.7 + 3(5.69) = 23.77 million.
There are no outliers in this data because there are no populations larger than 23.77 million. All data is within 3 standard deviations of the mean.
Appendix Lesson 4 841
APPENDIX LESSONS
