Page 43 - JDR Market Update Mid Year 2019_Final
P. 43

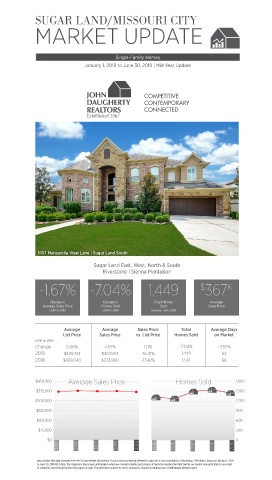
SUGAR LAND/MISSOURI CITY
                 MARKET UPDATE


                                                     Single-Family Homes

                                       January 1, 2019 to June 30, 2019 | Mid-Year Update


                                                                  COMPETITIVE
                                                                  CONTEMPORARY
                                                                  CONNECTED


                  5107 Manzanilla View Lane | Sugar Land South


                                           Sugar Land East, West, North & South
                                               Riverstone | Sienna Plantation

                   -1.67% -7.04%                                    1,449                  $ 367       K


                        Change in              Change in              Total Homes               Average
                    Average Sales Price        Homes Sold                Sold                  Sales Price
                       (2019 to 2018)          (2019 to 2018)        (January - June 2019)


                              Average          Average         Sales Price         Total        Average Days
                             List Price       Sales Price     vs. List Price    Homes Sold        on Market
                 (2019 vs. 2018)
                 Change        0.06%            -1.67%            1.11%           -7.04%           -4.55%
                 2019         $439,319         $367,653          -16.31%           1,449             63
                 2018        $439,040          $373,890          -17.42%           1,551             66


                 $450,000       Average Sales Price                             Homes Sold                 1,800

                 $375,000                                                                                  1,500

                 $300,000                                                                                  1,200

                 $225,000                                                                                  900

                  $150,000                                                                                 600
                  $75,000                                                                                  300

                      $0                                                                                   0
                           2015     2016     2017     2018     2019    2015     2016    2017     2018     2019


                  We consider this data compiled from MLS to be reliable information. If your home is presently offered for sale, this is not a solicitation of the listing. 2019 data is based on January 1, 2019
                  to June 30, 2019 MLS data. This material is based upon information which we consider reliable, but because it has been supplied by third parties, we cannot represent that it is accurate
                  or complete and it should not be relied upon as such. This offering is subject to errors, omissions, changes including price or withdrawal without notice.
   38   39   40   41   42   43   44   45   46   47   48