
Page 28 - The Impact of the 2018 Trade War on U.S. Prices and Welfare
P. 28
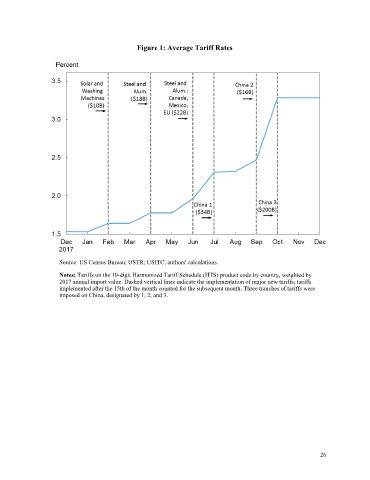
Figure 1: Average Tariff Rates


                     Source: US Census Bureau; USTR; USITC; authors' calculations.
                     Notes: Tariffs on the 10-digit Harmonized Tariff Schedule (HTS) product code by country, weighted by
                     2017 annual import value. Dashed vertical lines indicate the implementation of major new tariffs; tariffs
                     implemented after the 15th of the month counted for the subsequent month. Three tranches of tariffs were
                     imposed on China, designated by 1, 2, and 3.


                                                                                                           26