
Page 21 - 98 Crowley Street, Zillmere | Place + Karen
P. 21
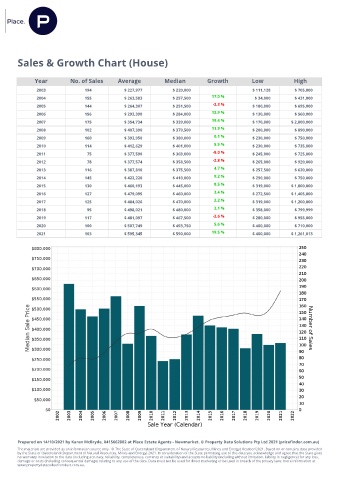
Sales & Growth Chart (House)


             Year         No. of Sales    Average          Median         Growth         Low            High
              2003             194           $ 227,977        $ 220,000                   $ 111,128     $ 705,000
              2004             155           $ 263,583        $ 257,500    17.0 %         $ 34,000      $ 431,000
              2005             144           $ 264,307        $ 251,500     -2.3 %        $ 180,000     $ 695,000
              2006             156           $ 293,390        $ 284,000    12.9 %         $ 130,000     $ 560,000
              2007             175           $ 354,734        $ 339,000    19.4 %         $ 170,000    $ 2,800,000
              2008             102           $ 407,390        $ 379,500    11.9 %         $ 200,000     $ 890,000
              2009             160           $ 393,950        $ 380,000     0.1 %         $ 230,000     $ 750,000
              2010             114           $ 412,629        $ 401,000     5.5 %         $ 230,000     $ 735,000
              2011              75           $ 377,590        $ 369,000     -8.0 %        $ 245,000     $ 725,000
              2012              78           $ 377,574        $ 358,500     -2.8 %        $ 265,000     $ 920,000
              2013             116           $ 387,810        $ 375,500     4.7 %         $ 257,500     $ 620,000
              2014             145           $ 422,220        $ 410,000     9.2 %         $ 290,000     $ 750,000
              2015             130           $ 460,193        $ 445,000     8.5 %         $ 319,000    $ 1,800,000
              2016             127           $ 479,095        $ 460,000     3.4 %         $ 272,500    $ 1,405,000
              2017             125           $ 484,026        $ 470,000     2.2 %         $ 319,000    $ 1,200,000
              2018              95           $ 498,021        $ 480,000     2.1 %         $ 358,000     $ 799,999
              2019             117           $ 481,097        $ 467,500     -2.6 %        $ 280,000     $ 955,000
              2020             100           $ 507,749        $ 493,750     5.6 %         $ 400,000     $ 710,000
              2021             103           $ 595,345        $ 590,000    19.5 %         $ 400,000    $ 1,261,013


       Prepared on 14/10/2021 by Karen McBryde, 0415662802 at Place Estate Agents - Newmarket. © Property Data Solutions Pty Ltd 2021 (pricefinder.com.au)
       The materials are provided as an information source only.  © The State of Queensland (Department of Natural Resources, Mines and Energy) October/2021. Based on or contains data provided
       by the State of Queensland (Department of Natural Resources, Mines and Energy) 2021. In consideration of the State permitting use of this data you acknowledge and agree that the State gives
       no warranty in relation to the data (including accuracy, reliability, completeness, currency or suitability) and accepts no liability (including without limitation, liability in negligence) for any loss,
       damage or costs (including consequential damage) relating to any use of the data. Data must not be used for direct marketing or be used in breach of the privacy laws; more information at
       www.propertydatacodeofconduct.com.au.