
Page 44 - Clackamas County Watertourism Strategic Plan. Final.v3
P. 44
STRATEGIC PLAN FOR WATER-BASED TOURISM IN CLACKAMAS COUNTY, OREGON THE PEOPLE
4-2
Sampling Methodology
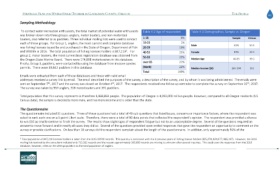
To contact water recreation enthusiasts, the total market of potential water enthusiasts Table 4-2 Age of respondent Table 4-1 Demographics, Sample vs. Oregon
was broken down into three groups: anglers, motor boaters, and non-motorized
1-18 0% Sample Census
boaters, also referred to as paddlers. Three individual mailing lists were used to contact
each of these groups. For Group 1, anglers, the most current and complete database 19-25 1%
Male 81% 50.5
was fishing licenses issued by and purchased in the State of Oregon, Department of Fish 26-39 10%
2
and Wildlife in 2016. The total population of fishing licenses holders is 847,219 . For 40-55 25% Female 19% 49.5
group 2, motor boaters, the most current boat registration database was obtained from
56-65 22%
the Oregon State Marine Board. There were 174,808 motorboaters in this database. Median Age 40-55 39.1
Finally, Group 3, paddlers, were contacted by using the database from invasive species over 65 21%
permits. There were 19,842 paddlers in this database. (blank) 22% Median Income ($K) $65-$99 $51
Total 100%
Emails were extracted from each of these databases and those with valid email
addresses received a survey link by email. The email described the purposes of the survey, a description of the survey, and by whom it was being administered. The emails were
th
th
th
sent on September 7 , 2017 and the survey was closed on October 4 , 2017. The respondents received one follow up reminder to complete the survey on September 20 , 2017.
The survey was taken by 959 anglers, 358 motorboaters and 391 paddlers.
Total population that this survey represents is therefore 1,068,869 people. The population of Oregon is 4,093,000 million people. However, compared to all Oregon residents (US
Census data), the sample is decidedly more male, and has more income and is older than the state.
The Questionnaire
The questionnaire included 31 questions. Three of these questions had a total of 49 sub-questions that listed issues, concerns or importance factors, where the respondent was
asked to rank each one on a 5-point Likert scale. Therefore, there were a total of 80 data points that collected the respondent’s opinion. The respondent was provided a chance
to win $50 as small incentive to finish the survey. The results show slight signs of respondent fatigue but not to an unacceptable degree. Several of the questions required an
answer to move forward and in nearly all cases they did so. Several of the questions provided open ended responses that gave the respondent an opportunity to comment on the
survey or provide clarifications. On less than 10 surveys did the respondent complain about the length of the questionnaire. In addition, only approximately 50% of the
2 Total population of 847,219 licenses holders is taken from the 2015 ODFW records. This quantity is consistent with the 3 previous years of fishing license holders (825,274; 824,977; 865,197). However, the 2016
mailing list received by the consultant included only 715,582 records and the reason approximately 100,000 records are missing is unknown after several inquiries. This study uses the responses from the 2016
database, however, relies on the 2015 population as the total population of anglers.