
Page 12 - Tampa Metropolitan Area YMCA Annual Report 2020
P. 12
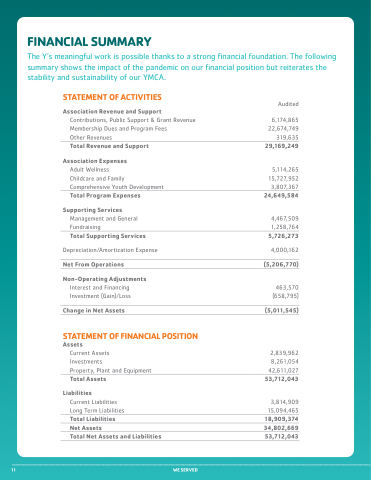
 FINANCIAL SUMMARY
The Y’s meaningful work is possible thanks to a strong financial foundation. The following summary shows the impact of the pandemic on our financial position but reiterates the stability and sustainability of our YMCA.
STATEMENT OF ACTIVITIES
Association Revenue and Support
Contributions, Public Support & Grant Revenue Membership Dues and Program Fees
Other Revenues
 Audited
6,174,865
22,674,749
319,635
Total Revenue and Support
Association Expenses
Adult Wellness
Childcare and Family Comprehensive Youth Development
 29,169,249
5,114,265
15,727,952
3,807,367
  Total Program Expenses
Supporting Services
Management and General Fundraising
24,649,584
4,467,509
1,258,764
  Total Supporting Services
Depreciation/Amortization Expense
5,726,273
4,000,162
  Net From Operations
 (5,206,770)
Non-Operating Adjustments
Interest and Financing Investment (Gain)/Loss
 463,570
(658,795)
  Change in Net Assets
 (5,011,545)
 STATEMENT OF FINANCIAL POSITION
Assets
Current Assets
Investments
Property, Plant and Equipment
2,839,962
8,261,054
42,611,027
  Total Assets
Liabilities
Current Liabilities Long Term Liabilities
53,712,043
3,814,909
15,094,465
  Total Liabilities
18,909,374
 Net Assets
 34,802,669
 Total Net Assets and Liabilities
  53,712,043
      11
WE SERVED
