
Page 41 - CNB Bank Shares 2018 Annual Report
P. 41
CNB BANK SHARES, INC. AND SUBSIDIARIES CNB BANK SHARES, INC. AND SUBSIDIARIES
Notes to Consolidated Financial Statements Notes to Consolidated Financial Statements
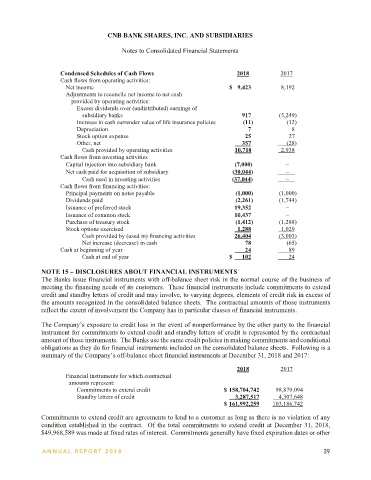
Following are condensed balance sheets as of December 31, 2018 and 2017 and the related condensed Condensed Schedules of Cash Flows 2018 2017
schedules of income and cash flows (in thousands of dollars) for the years then ended of the Company (parent Cash flows from operating activities:
company only): Net income $ 9,423 8,192
Adjustments to reconcile net income to net cash
Condensed Balance Sheets 2018 2017 provided by operating activities:
Assets: Excess dividends over (undistributed) earnings of
Cash $ 102 24 subsidiary banks 917 (5,249)
Investment in subsidiaries banks 124,985 83,753 Increase in cash surrender value of life insurance policies (11) (12)
Available-for-sale equity securities 57 57 Depreciation 7 8
Life insurance policies 696 685 Stock option expense 25 27
Income tax receivable 1,733 1,316 Other, net 357 (28)
Property and equipment, net 12 19 Cash provided by operating activities 10,718 2,938
Total assets $ 127,585 85,854 Cash flows from investing activities
Capital injection into subsidiary bank (7,000) −
Liabilities: Net cash paid for acquisition of subsidiary (30,044) −
Accounts payable $ 377 327 Cash used in investing activities (37,044) −
Notes payable 7,547 1,847 Cash flows from financing activities:
Total liabilities 7,924 2,174 Principal payments on notes payable (1,000) (1,000)
Total stockholders’ equity 119,661 83,680 Dividends paid (2,261) (1,744)
Total liabilities and stockholders’ equity $ 127,585 85,854
Issuance of preferred stock 19,352 −
Issuance of common stock 10,437 −
Condensed Schedules of Income 2018 2017 Purchase of treasury stock (1,412) (1,288)
Revenue: Stock options exercised 1,288 1,029
Cash dividends from subsidiaries banks $ 12,310 3,200 Cash provided by (used in) financing activities 26,404 (3,003)
Other income 11 12 Net increase (decrease) in cash 78 (65)
Total revenue 12,321 3,212 Cash at beginning of year 24 89
Expenses: Cash at end of year $ 102 24
Salaries and benefits 25 27
Interest expense 249 87 NOTE 15 – DISCLOSURES ABOUT FINANCIAL INSTRUMENTS
Depreciation 7 8 The Banks issue financial instruments with off-balance sheet risk in the normal course of the business of
Legal and professional fees 2,350 147
Miscellaneous expenses 215 128 meeting the financing needs of its customers. These financial instruments include commitments to extend
Total expenses 2,846 397 credit and standby letters of credit and may involve, to varying degrees, elements of credit risk in excess of
Income before income tax benefit and equity in the amounts recognized in the consolidated balance sheets. The contractual amounts of those instruments
undistributed (excess dividends over) net income of reflect the extent of involvement the Company has in particular classes of financial instruments.
subsidiary banks 9,475 2,815
Income tax benefit 865 128 The Company’s exposure to credit loss in the event of nonperformance by the other party to the financial
10,340 2,943 instrument for commitments to extend credit and standby letters of credit is represented by the contractual
Equity in (excess dividends over) undistributed net income amount of those instruments. The Banks use the same credit policies in making commitments and conditional
of subsidiary banks (917) 5,249 obligations as they do for financial instruments included on the consolidated balance sheets. Following is a
Net income $ 9,423 8,192 summary of the Company’s off-balance sheet financial instruments at December 31, 2018 and 2017:
2018 2017
Financial instruments for which contractual
amounts represent:
Commitments to extend credit $ 158,704,742 98,879,094
Standby letters of credit 3,287,517 4,307,648
$ 161,992,259 103,186,742
Commitments to extend credit are agreements to lend to a customer as long as there is no violation of any
condition established in the contract. Of the total commitments to extend credit at December 31, 2018,
$49,968,589 was made at fixed rates of interest. Commitments generally have fixed expiration dates or other
38 ANNUAL REPOR T 2018 ANNUAL REPOR T 2018 39