
Page 56 - HBR's 10 Must Reads 20180 - The Definitive Management Ideas of the Year from Harvard Business Review
P. 56
VISUALIZATIONS THAT REALLY WORK
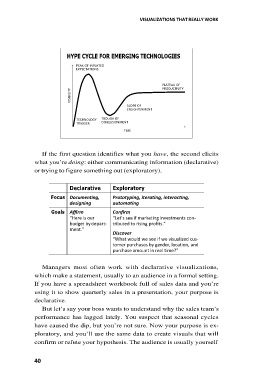
HYPE CYCLE FOR EMERGING TECHNOLOGIES
PEAK OF INFLATED
EXPECTATIONS
PLATEAU OF
PRODUCTIVITY
VISIBILITY
SLOPE OF
ENLIGHTENMENT
TROUGH OF
TECHNOLOGY DISILLUSIONMENT
TRIGGER
TIME
If the first question identifies what you have, the second elicits
what you’re doing: either communicating information (declarative)
or trying to figure something out (exploratory).
Declarative Exploratory
Focus Documenting, Prototyping, iterating, interacting,
designing automating
Goals Affirm Confirm
“Here is our “Let’s see if marketing investments con-
budget by depart- tributed to rising profits.”
ment.”
Discover
“What would we see if we visualized cus-
tomer purchases by gender, location, and
purchase amount in real time?”
Managers most often work with declarative visualizations,
which make a statement, usually to an audience in a formal setting.
If you have a spreadsheet workbook full of sales data and you’re
using it to show quarterly sales in a presentation, your purpose is
declarative.
But let’s say your boss wants to understand why the sales team’s
performance has lagged lately. You suspect that seasonal cycles
have caused the dip, but you’re not sure. Now your purpose is ex-
ploratory, and you’ll use the same data to create visuals that will
confirm or refute your hypothesis. The audience is usually yourself
40