
Page 225 - eProceeding - IRSTC & RESPEX 2017
P. 225
Hazman Mat / JOJAPS – JOURNAL ONLINE JARINGAN COT POLIPD
3.5 Data Collection Procedures
The sample should be a representation of the general population. According to (Field, 2005) sample is a smaller (but hopefully
representative) collection of units from a population used to determine truths about that population. For this study, data will be
collected from the questionnaire that will distribute and approach every loan applicant around Kuantan.
4.0 Data Analysis
All collected data has been analyzed using Statistical Package for Social Science Software (SPSS) to analysis data earned.
Processing data is collecting, preparations, analyzing, restore and production data technique Mohd Najib, (2000). Data cleaning shows
that the data is complete and no outlier occurred (Hair et al. 2010). Descriptive analysis used to describe information about research
question by using percentage, mean score and standard deviation.
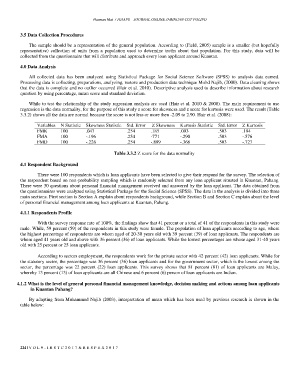
While to test the relationship of the study regression analysis are used (Hair et al. 2010 & 2008). The main requirement to use
regression is the data normality, for the purpose of this study z score for skewness and z score for kurtosis were used. The result (Table
3.3.2) shows all the data are normal because the score is not less or more then -2.09 to 2.90. Hair et al. (2008):
Variables N Statistic Skewness Statistic Std. Error Z Skewness Kurtosis Statistic Std. Error Z Kurtosis
FMK 100 .047 .254 .185 .093 .503 .184
FMA 100 -.196 .254 -771 -.290 .503 -.576
FMD 100 -.226 .254 -.889 -.366 .503 -.727
Table 3.3.2 Z score for the data normality
4.1 Respondent Background
There were 100 respondents which is loan applicants have been selected to give their respond for the survey. The selection of
the respondent based on non-probability sampling which is randomly selected from any loan applicant situated in Kuantan, Pahang.
There were 30 questions about personal financial management received and answered by the loan applicant. The data obtained from
the questionnaires were analyzed using Statistical Package for the Social Science (SPSS). The data in the analysis is divided into three
main sections. First section is Section A explain about respondents background, while Section B and Section C explain about the level
of personal financial management among loan applicants at Kuantan, Pahang.
4.1.1 Respondents Profile
With the survey response rate of 100%, the findings show that 41 percent or a total of 41 of the respondents in this study were
male. While, 59 percent (59) of the respondents in this study were female. The population of loan applicants according to age, where
the highest percentage of respondents are whom aged of 20-30 years old with 39 percent (39) of loan applicants. The respondents are
whom aged 41 years old and above with 36 percent (36) of loan applicants. While the lowest percentages are whose aged 31-40 years
old with 25 percent or 25 loan applicants.
According to sectors employment, the respondents work for the private sector with 42 percent (42) loan applicants. While for
the statutory sector, the percentage was 36 percent (36) loan applicants and for the government sector, which is the lowest among the
sector, the percentage was 22 percent (22) loan applicants. This survey shows that 81 percent (81) of loan applicants are Malay,
whereby 13 percent (13) of loan applicants are all Chinese and 6 percent (6) person of loan applicants are Indian.
4.1.2 What is the level of general personal financial management knowledge, decision making and actions among loan applicants
in Kuantan Pahang?
By adapting from Muhammad Najib (2003), interpretation of mean which has been used by previous research is shown in the
table below:
224 | V O L 9 - I R S T C 2 0 1 7 & R E S P E X 2 0 1 7