
Page 259 - eProceeding - IRSTC & RESPEX 2017
P. 259
Nurul Izzah / JOURNAL ONLINE JARINGAN COT POLIPD
4.2 Comparison of the mean score of the students’ PLO achievement score from the survey with actual achievement.
This comparison is made to answer the objectives of the second study. In this section, the mean score for each PLO will be
compared to the actual PLO achievement in which the student was assessed during the course of the study by the lecturer. Actual
PLO achievement data was obtained through the Polytechnic Informatics Management System (SPMP) for December 2016
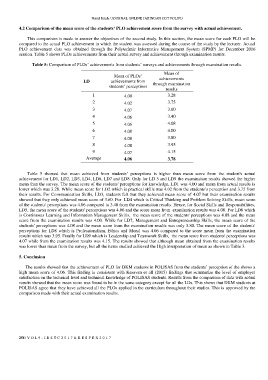
session. Table 5 shows PLOs achievements from their actual survey and achievement through examination results.
Table 5: Comparison of PLOs’ achievements from students’ surveys and achievements through examination results.
Mean of PLOs’ Mean of
LD achievements from achievements
students’ perceptions through examination
results
1 4.00 3.28
2 4.02 3.75
3 4.07 3.60
4 4.06 3.40
5 4.08
4.06
6 4.08 4.00
7 4.08 3.80
8 3.95
4.08
9 4.07 4.15
Average 4.06 3.78
mean
mean
Table 5 showed that mean achieved from students’ perceptions is higher than mean score from the student's actual
achievement for LD1, LD2, LD3, LD4, LD6, LD7 and LD8. Only for LD 5 and LD9 the examination results showed the higher
mean than the survey. The mean score of the students' perceptions for knowledge, LD1 was 4.00 and mean from actual results is
lower which was 3.28. While mean score for LD2 which is practical skills was 4.02 from the students’s perception and 3.75 from
their results. For Communication Skills, LD3, students felt that they achieved mean score of 4.07 but their examination results
showed that they only achieved mean score of 3.60. For LD4 which is Critical Thinking and Problem Solving Skills, mean score
of the students' perceptions was 4.06 compared to 3.40 from the examination results. Hence, for Social Skills and Responsibilities,
LD5, the mean score of the students' perceptions was 4.06 and the score mean from examination results was 4.08. For LD6 which
is Continuous Learning and Information Management Skills, the mean score of the students' perceptions was 4.08 and the mean
score from the examination results was 4.00. While for LD7, Management and Entrepreneurship Skills, the mean score of the
students' perceptions was 4.08 and the mean score from the examination results was only 3.80. The mean score of the students'
perceptions for LD8 which is Professionalism, Ethics and Moral was 4.06 compared to the score mean from the examination
results which was 3.95. Finally for LD9 which is Leadership and Teamwork Skills, the mean score from students' perceptions was
4.07 while from the examination results was 4.15. The results showed that although mean obtained from the examination results
was lower than mean from the survey, but all the items studied achieved the High interpretation of mean as shown in Table 3.
5. Conclusion
The results showed that the achievement of PLO for DKM students in POLISAS from the students’ perception of the shows a
high mean score of 4.06. This finding is consistent with Kesavan et all (2015) findings that summarize the level of employer
satisfaction on the technical level and technical knowledge of POLISAS students. Results from the comparison of data with actual
results showed that the mean score was found to be in the same category except for all the LDs. This shows that DKM students at
POLISAS agree that they have achieved all the PLOs applied in the curriculum throughout their studies. This is approved by the
comparison made with their actual examination results.
258 | V O L 9 - I R S T C 2 0 1 7 & R E S P E X 2 0 1 7