Page 44 - eProceeding - IRSTC & RESPEX 2017
P. 44

Khairun Nizam b Sa’adan/ JOJAPS – JOURNAL ONLINE JARINGAN COT POLIPD
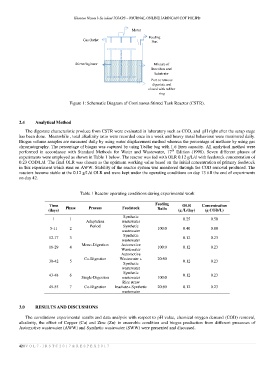
                                                            Motor

                                      Gas Outlet                   Feeding
                                                                    Port


                                   Stirrer/Agitator                  Mixture of
                                                                    Inoculum and
                                                                      Substrate
                                                                    Port to remove
                                                                     digestate and
                                                                   closed with rubber
                                                                        ring

                                Figure 1: Schematic Diagram of Continuous Stirred Tank Reactor (CSTR).


          2.4    Analytical Method

            The digestate characteristic produce from CSTR were evaluated in laboratory such as COD, and  pH right after the setup stage
          has been done.  Meanwhile , total alkalinity ratio were recorded once in a week and heavy metal behaviour were monitored daily.
          Biogas volume samples are measured daily by using water displacement method whereas the percentage of methane by using gas
          chromatography. The percentage of biogas was captured by using Tedlar bag with 1.6 litres capacity. All analytical method were
                                                                             th
          performed  in  accordance  with  Standard  Methods  for  Water  and  Wastewater,  17   Edition  (1998).  Seven  different  phases  of
          experiments were employed as shown in Table 1 below. The reactor was fed with OLR 0.12 g/L/d with feedstock concentration of
          0.23 COD/L/d. The final OLR was chosen as the optimum working value based on the initial concentration of primary feedstock
          in this experiment which runs on AWW. Stability of the reactor system was monitored through the COD removal produced. The
          reactors become stable at the 0.12 g/L/d OLR and were kept under the operating conditions on day 13 till the end of experiments
          on day 42.


                                     Table 1 Reactor operating conditions during experimental work

                       Time   Phase     Process        Feedstock      Feeding     OLR      Concentration
                       (days)                                          Ratio    (g /L/day)   (g COD/L)
                                                        Synthetic
                        1       1                                                 0.25         0.50
                                       Adaptation      wastewater
                                         Period         Synthetic
                       5-11     2                                      100:0      0.40         0.80
                                                       wastewater
                                                        Synthetic
                       12-17    3                                                 0.12         0.23
                                                       wastewater
                                     Mono-Digestion    Automotive
                       18-29    4                                      100:0      0.12         0.23
                                                       Wastewater
                                                       Automotive
                                      Co-Digestion    Wastewater +     20:80
                       30-42    5                                                 0.12         0.23
                                                        Synthetic
                                                       wastewater
                                                        Synthetic
                       43-48    6                                                 0.12         0.23
                                     Single-Digestion   wastewater     100:0
                                                       Rice straw
                       49-55    7     Co-Digestion   leachate+ Synthetic   20:80   0.12        0.23
                                                       wastewater


          3.0    RESULTS AND DISCUSSIONS

            The correlations experimental results and data analysis with respect to pH value, chemical oxygen demand (COD) removal,
          alkalinity,  the  effect  of  Copper  (Cu)  and  Zinc  (Zn)  in  anaerobic  condition  and  biogas  production  from  different  processes  of
          Automotive wastewater (AWW) and Synthetic wastewater (SWW) were presented and discussed.


          42 | V O L 7 - I R S T C 2 0 1 7 & R E S P E X 2 0 1 7
   39   40   41   42   43   44   45   46   47   48   49