
Page 549 - eProceeding - IRSTC & RESPEX 2017
P. 549
th
Nuradilah Binti Abas / IRSTC 2017 – 4 INTERNATIONAL SEMINAR : INNOVATION for RESEARCH SCIENCE, TECHNOLOGY & CULTURE
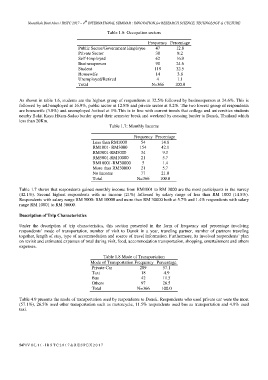
Table 1.6: Occupation sectors
Frequency Percentage
Public Sector/Government Employee 47 12.8
Private Sector 30 8.2
Self-Employed 62 16.9
Businessperson 90 24.6
Student 119 32.5
Housewife 14 3.8
Unemployed/Retired 4 1.1
Total N=366 100.0
As shown in table 1.6, students are the highest group of respondents at 32.5% followed by businessperson at 24.6%. This is
followed by self-employed at 16.9%, public sector at 12.8% and private sector at 8.2%. The two lowest group of respondents
are housewife (3.8%) and unemployed /retired at 1%.This is in line with current trends that college and universities students
nearby Bukit Kayu Hitam-Sadao border spend their semester break and weekend by crossing border to Danok, Thailand which
less than 20Km.
Table 1.7: Monthly Income
Frequency Percentage
Less than RM1000 54 14.8
RM1001- RM3000 154 42.1
RM3001-RM5000 34 9.3
RM5001-RM10000 21 5.7
RM10001-RM30000 5 1.4
More than RM30000 21 5.7
No Income 77 21.0
Total N=366 100.0
Table 1.7 shows that respondents gained monthly income from RM1001 to RM 3000 are the most participants in the survey
(42.1%). Second highest respondents with no income (21%) followed by salary range of less than RM 1000 (14.8%).
Respondents with salary range RM 5000- RM 10000 and more than RM 30000 both at 5.7% and 1.4% respondents with salary
range RM 10001 to RM 30000.
Description of Trip Characteristics
Under the description of trip characteristics, this section presented in the form of frequency and percentage involving
respondents’ mode of transportation, number of visit to Danok in a year, traveling partner, number of partners traveling
together, length of stay, type of accommodation and source of travel information. Furthermore, its involved respondents’ plan
on revisit and estimated expanses of total during visit, food, accommodation transportation, shopping, entertainment and others
expenses.
Table 1.8 Mode of Transportation
Mode of Transportation Frequency Percentage
Private Car 209 57.1
Taxi 18 4.9
Bus 42 11.5
Others 97 26.5
Total N=366 100.0
Table 4.9 presents the mode of transportation used by respondents to Danok. Respondents who used private car were the most
(57.1%), 26.5% used other transportation such as motorcycle, 11.5% respondents used bus as transportation and 4.9% used
taxi.
547 | V O L 1 1 - I R S T C 2 0 1 7 & R E S P E X 2 0 1 7