
Page 36 - Annual Report 2018
P. 36
121,256 CashandNcasohteequsivalteontsthe nancialstatements (continued)
121,256 114,310
25,927 336,078
1,010,250 530,250
1,036,177 866,328
bank and on hand
25,927 1,010,250
1,036,177
Notes 2018
posits
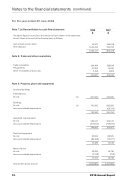
Note 7. Cash and cash equivalents Cash at bank and on hand
Term deposits
For the year ended 30 June 2018
Note 7.(a) Reconciliation to cash ow statement
Note 7.(a) Reconciliation to cash flow statement a) Reconciliation to cash flow statement
Notes
2018 $
25,927
Heidelberg District Community Enterprise Limited delbergDThiesatbroivcetfigCureosmrecomnciulentoitthyeamEonuntteofrcpasrhisheownLinmtheitsteatdement
ve figures reconcile to the amount of cash shown in the statement
delberg DoficsatshriflcowtsCatothme enmd ouf thneiftinyanEcianl yteearraspforliloswes: Limited flows at the end of the financial year as follows:
Notes to the Financial Statements es to the Financial Statements
es to the Financial Statements
Cash at bank and on hand
bank and on hafnodr the year ended 30 June 2018
e year ended 30 June 2018
25,927 1,010,250
336,078
posits
1,036,177 1,036,177
866,328 866,328
ceivables mcenivtas bles
Trade receivables
Prepayments
194,494
13914,94954
351,395985
5,358 231,847
231,847
19 607,500
607,500 742,50019
194,494 188,649
Term deposits
1,010,250
e year ended 30 June 2018
530,250 1,036,177
Note 8. Trade and other receivables
Note 8. Trade and other receivables Trade and other receivables
Trade and other receivables
Other receivables and accruals meceenivtsables and accruals
eceivables and accruals Property,NpNolaotnteta9n.dPerqoupPiperomrpteyen,rtpy,lapnlatnatannddequiipmeentnt
Property, plant and equipment
Land and buildings
Freehold land At cost
11858,568429
d buildings d buildings
d land d land
19 19
19 19
607,500 440,000
440,000 660,007042,500
ents in carrying amounts:
2018 Annual Report
ents in carrying amounts:
Buildings
s
s
umulated depreLecisastiaocncumulated depreciation umulated depreciation
old improvemenLtesasehold improvements old improvemenAtst cost
umulated depreLecisastiaocncumulated depreciation umulated depreciation
d equipment Plant and equipment
d equipment At cost
umulated depreLecisastiaocncumulated depreciation umulated depreciation
Vehicle Motor Vehicle Vehicle At cost
umulated depreLecisastiaocncumulated depreciation umulated depreciation
itten down amoTuontatl written down amount itten down amount
Property, plant and equipment (continued)
Note 9. Property, plant and equipment (continued)
Property, plant and equipment (continued) 34.
At cost
Movements in carrying amounts:
$ $
2017 $$
742,5-00 -
6(608,07050) - (68,750)
742,500 742,500
591,257042,500 591,250
506,537
(255076,655347)
(257,654) 248,883
248,883 95,694
506,535706,537
(253096,85(732275)7,654)
(239,872) 266,662548,883
266,665 89,50595,694
(9850,629048) (80,208)
(8795,5907(578)0,208) (75,977)
15,486 15,486
13,52815,486 13,528
154,588029
39,950
3(29,591580)
(2,518) 37,432
37,432
1,651,801 1,327,19,86151,801 1 1,651,801 1,327,981
2018 2017 20$18 20$17 $
4,809
209,040 209,040
31,995
5,358 231,847
16,79639,950 16(,729568()2,518)
(258) 16,53837,432
16,538
2018
