
Page 10 - Sociology and You
P. 10
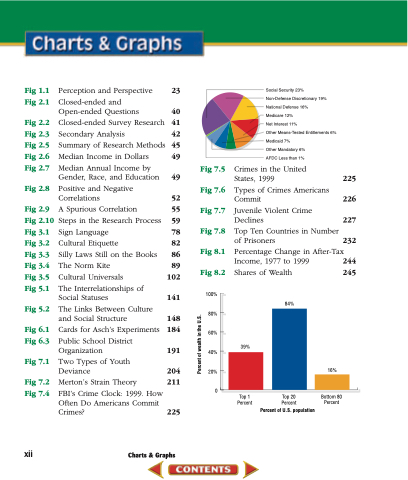
  Social Security 23%
Non-Defense Discretionary 19% National Defense 16%
Medicare 12%
Net Interest 11%
Other Means-Tested Entitlements 6% Medicaid 7%
Other Mandatory 6%
AFDC Less than 1%
    Fig 1.1 Fig 2.1
Fig 2.2 Fig 2.3 Fig 2.5 Fig 2.6 Fig 2.7
Fig 2.8
Fig 2.9 Fig 2.10 Fig 3.1 Fig 3.2 Fig 3.3 Fig 3.4 Fig 3.5 Fig 5.1
Fig 5.2
Fig 6.1 Fig 6.3
Fig 7.1
Fig 7.2 Fig 7.4
Perception and Perspective 23 Closed-ended and
Open-ended Questions 40 Closed-ended Survey Research 41 Secondary Analysis 42 Summary of Research Methods 45 Median Income in Dollars 49 Median Annual Income by
Gender, Race, and Education 49 Positive and Negative
Correlations 52 A Spurious Correlation 55 Steps in the Research Process 59 Sign Language 78 Cultural Etiquette 82 Silly Laws Still on the Books 86 The Norm Kite 89 Cultural Universals 102 The Interrelationships of
Social Statuses 141 The Links Between Culture
and Social Structure 148 Cards for Asch’s Experiments 184
Public School District
Organization 191
Two Types of Youth
Deviance 204
Merton’s Strain Theory 211
Fig 7.5 Fig 7.6 Fig 7.7 Fig 7.8 Fig 8.1 Fig 8.2
Crimes in the United
States, 1999 225
Types of Crimes Americans Commit 226
Juvenile Violent Crime
Declines 227
Top Ten Countries in Number
of Prisoners 232
Percentage Change in After-Tax Income, 1977 to 1999 244
Shares of Wealth 245
 100%
80%
60%
40% 20% 0
84%
                 39%
Top 1 Percent
Top 20 Percent
16%
Bottom 80 Percent
               Percent of U.S. population
xii
Charts & Graphs
FBI’s Crime Clock: 1999. How Often Do Americans Commit Crimes?
225
 Percent of wealth in the U.S.
