
Page 12 - Sociology and You
P. 12
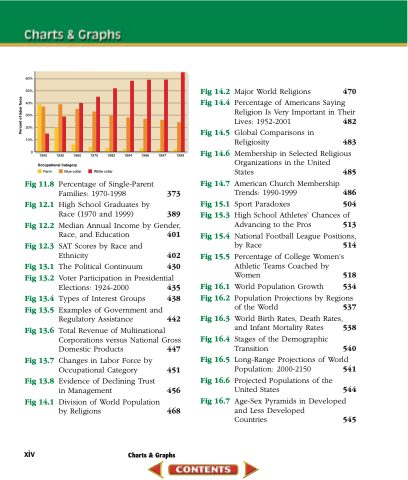
   60% 50% 40% 30% 20% 10%
0
1900 1930
1960
1970 1982
White collar
1994 1996 1997 1999
  Occupational Category
Farm Blue collar
                        Fig 11.8
Fig 12.1
Fig 12.2
Fig 12.3
Fig 13.1 Fig 13.2
Fig 13.4 Fig 13.5
Fig 13.6
Fig 13.7 Fig 13.8 Fig 14.1
Percentage of Single-Parent Families: 1970-1998 373
High School Graduates by
Race (1970 and 1999) 389
Median Annual Income by Gender, Race, and Education 401
SAT Scores by Race and
Ethnicity 402
The Political Continuum 430 Voter Participation in Presidential
Elections: 1924-2000 435 Types of Interest Groups 438
Examples of Government and Regulatory Assistance 442
Total Revenue of Multinational Corporations versus National Gross Domestic Products 447
Changes in Labor Force by Occupational Category 451
Evidence of Declining Trust
in Management 456
Fig 14.2 Fig 14.4
Fig 14.5 Fig 14.6
Fig 14.7
Fig 15.1 Fig 15.3
Fig 15.4 Fig 15.5
Fig 16.1 Fig 16.2
Fig 16.3 Fig 16.4 Fig 16.5 Fig 16.6 Fig 16.7
Major World Religions 470
Percentage of Americans Saying Religion Is Very Important in Their Lives: 1952-2001 482
Global Comparisons in
Religiosity 483
Membership in Selected Religious Organizations in the United
States 485
American Church Membership Trends: 1990-1999 486
Sport Paradoxes 504 High School Athletes’ Chances of
Advancing to the Pros 513 National Football League Positions,
by Race 514
Percentage of College Women’s Athletic Teams Coached by Women 518
World Population Growth 534 Population Projections by Regions
of the World 537 World Birth Rates, Death Rates,
and Infant Mortality Rates 538 Stages of the Demographic
Transition 540 Long-Range Projections of World
Population: 2000-2150 541 Projected Populations of the
United States 544
Age-Sex Pyramids in Developed and Less Developed
Countries 545
xiv
Charts & Graphs
Division of World Population by Religions
468
 Percent of labor force
