
Page 27 - Sociology and You
P. 27
the entire population is divided into subgroups. The same information can be presented in tables, but in numerical, rather than graphic, form. Tables
have the advantage of being able to present multiple categories of data in one location, whereas circle graphs are limited to one type of data.
Learning the Skill
Follow these steps to learn how to understand and use circle graphs and tables.
◆ Read the graph or table title to determine the content being pre-
sented.
◆ Read the labels (on circle graphs) or row headings (in tables).
These will tell you what information is to be compared.
◆ For tables, examine the labels in the left-hand column. They
describe ranges or subgroups and are often organized chronologi-
cally or alphabetically.
◆ Note the source of the data. It may tell you about the reliability of
the data or where to go for further information.
◆ Compare the data presented to discov-
er the relationships among categories.
Practicing the Skill
Study the table and circle graph, and then answer the following questions.
1. Which medium presents more informa- tion to the reader?
2. If you were concerned solely with the world’s population, which graph/table would you prefer? Why?
Applying the Skill
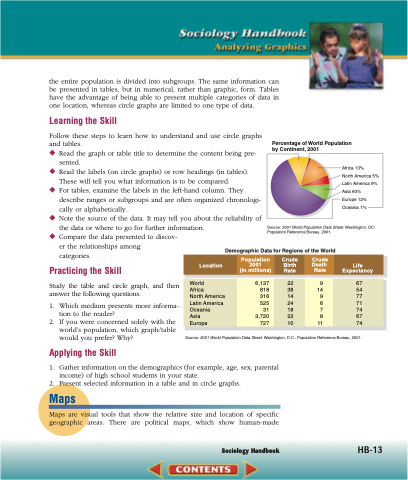
Percentage of World Population by Continent, 2001
Africa 13%
North America 5% Latin America 9% Asia 60%
Europe 12% Oceania 1%
Source: 2001 World Population Data Sheet. Washington, DC: Population Reference Bureau, 2001.
1. Gatherinformationonthedemographics(forexample,age,sex,parental income) of high school students in your state.
2. Present selected information in a table and in circle graphs.
Maps
Maps are visual tools that show the relative size and location of specific geographic areas. There are political maps, which show human-made
Location
World
Africa
North America Latin America Oceania
Asia
Europe
Demographic Data for Regions of the World
Population 2001
(in millions)
6,137 818 316 525 31 3,720 727
Crude Birth Rate
Source: 2001 World Population Data Sheet. Washington, D.C.: Population Reference Bureau, 2001.
22
38
14
24
18
22
10
Crude Death Rate
9 14 9 6 7 8 11
Life Expectancy
67
54
77
71
74
67
74
Sociology Handbook HB-13
