
Page 28 - Sociology and You
P. 28
boundaries; physical maps, which show physical features of an area; and special purpose maps that can show historical change, cultural features,
population, climate, land use, resources, or any other information of inter- est. Regardless of type, all maps use symbols to convey information.
Learning the Skill
Follow these steps to learn how to understand and use maps.
◆ Read the title to determine the map’s content.
◆ Examine the map’s scale, which indicates the ratio between the map’s
size and the actual area being represented. However, for many special purpose maps, this information will not be provided, and is not rele- vant to the information being presented.
◆ Read the legend, or key, to interpret any shapes, colors, boundary lines, or symbols. This step is, in many ways, the most important for maps of interest to sociologists.
◆ Interpret the information being presented. Determine patterns or other interesting points of interest. What questions does the map raise in
your mind?
Practicing the Skill
Study the map and answer the questions that follow.
1. What information does this map present to the reader?
2. Do you see any patterns in the information?
3 What questions does the map raise for you?
4. Where could you find the answers to the questions you posed?
Applying the Skill
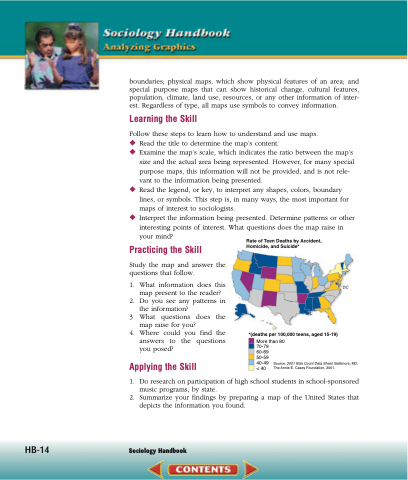
Rate of Teen Deaths by Accident, Homicide, and Suicide*
DC
1. Doresearchonparticipationofhighschoolstudentsinschool-sponsored music programs, by state.
2. Summarize your findings by preparing a map of the United States that depicts the information you found.
*(deathsper100,000teens,aged15-19)
More than 80 70-79
60-69
50-59
40-49 < 40
Source: 2001 Kids Count Data Sheet. Baltimore, MD: The Annie E. Casey Foundation, 2001.
HB-14 Sociology Handbook
