
Page 288 - Sociology and You
P. 288
258 Unit 3 Social Inequality
World View
World View
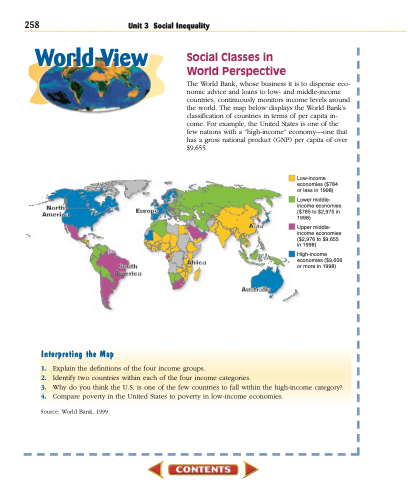
Social Classes in World Perspective
The World Bank, whose business it is to dispense eco- nomic advice and loans to low- and middle-income countries, continuously monitors income levels around the world. The map below displays the World Bank’s classification of countries in terms of per capita in- come. For example, the United States is one of the few nations with a “high-income” economy—one that has a gross national product (GNP) per capita of over $9,655.
North America
Europe
South America
Low-income economies ($784 or less in 1998)
Lower middle- income economies ($785 to $2,975 in 1998)
Upper middle- income economies ($2,976 to $9,655 in 1998)
High-income economies ($9,656 or more in 1998)
Africa
Asia
Australia
Interpreting the Map
1. Explain the definitions of the four income groups.
2. Identify two countries within each of the four income categories.
3. Why do you think the U.S. is one of the few countries to fall within the high-income category?
4. Compare poverty in the United States to poverty in low-income economies.
Source: World Bank, 1999.
