
Page 290 - Sociology and You
P. 290
260 Unit 3 Social Inequality
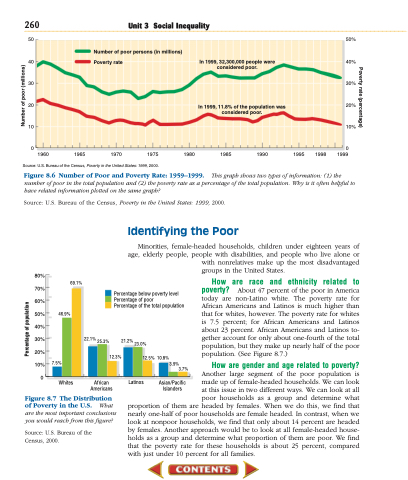
50 50%
Number of poor persons Poverty rate
(in millions)
40 40%
30 30%
20 20%
10 10%
00 1960 1965 1970 1975 1980 1985 1990 1995 1998 1999
Source: U.S. Bureau of the Census, Poverty in the United States: 1999, 2000.
In
In
1999, 32,300,000 people considered poor.
1999, 11.8% of the population was considered poor.
were
Figure8.6NumberofPoorandPovertyRate:1959–1999. Thisgraphshowstwotypesofinformation:(1)the number of poor in the total population and (2) the poverty rate as a percentage of the total population. Why is it often helpful to have related information plotted on the same graph?
Source: U.S. Bureau of the Census, Poverty in the United States: 1999, 2000.
80%
70%
60%
50% 46.9% 40%
30% 20% 10%
0
69.1%
22.1% 25.3%
Percentage below poverty level Percentage of poor
Percentage of the total population
21.2% 23.0%
12.3%
12.5% 10.8%
7.5%
3.9% 3.7%
Asian/Pacific Islanders
Whites
African Americans
Latinos
Figure 8.7 The Distribution ofPovertyintheU.S. What are the most important conclusions you would reach from this figure?
Source: U.S. Bureau of the Census, 2000.
Identifying the Poor
Minorities, female-headed households, children under eighteen years of age, elderly people, people with disabilities, and people who live alone or with nonrelatives make up the most disadvantaged
groups in the United States.
How are race and ethnicity related to poverty? About 47 percent of the poor in America today are non-Latino white. The poverty rate for African Americans and Latinos is much higher than that for whites, however. The poverty rate for whites is 7.5 percent; for African Americans and Latinos about 23 percent. African Americans and Latinos to- gether account for only about one-fourth of the total population, but they make up nearly half of the poor population. (See Figure 8.7.)
How are gender and age related to poverty?
Another large segment of the poor population is made up of female-headed households. We can look at this issue in two different ways. We can look at all poor households as a group and determine what
proportion of them are headed by females. When we do this, we find that nearly one-half of poor households are female headed. In contrast, when we look at nonpoor households, we find that only about 14 percent are headed by females. Another approach would be to look at all female-headed house- holds as a group and determine what proportion of them are poor. We find that the poverty rate for these households is about 25 percent, compared with just under 10 percent for all families.
Poverty rate (percentage)
Percentage of population
Number of poor (millions)
