
Page 321 - Sociology and You
P. 321
Chapter 9 Inequalities of Race and Ethnicity 291
because of white flight to the suburbs. As a result, minority children in many states are more concentrated in school districts with a tax base too low to provide resources equal to those in the suburbs. This lack of funding means that teachers in minority schools receive fewer opportunities for training. Textbooks, when students have them, are outdated. Parental and community support is generally not as strong. There is little, if any, money for new tech- nology, and buildings are badly in need of repair.
Institutionalized discrimination in the United States is reflected in the ex- periences of minorities—African Americans, Latinos, Native Americans, Asian Americans, white ethnics, and Jewish Americans. For each minority, the so- cial and economic costs of discrimination have been enormous.
African Americans
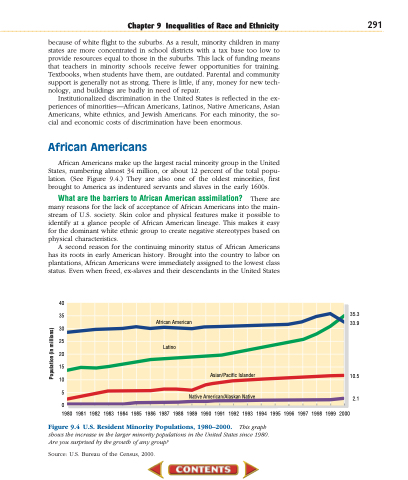
African Americans make up the largest racial minority group in the United States, numbering almost 34 million, or about 12 percent of the total popu- lation. (See Figure 9.4.) They are also one of the oldest minorities, first brought to America as indentured servants and slaves in the early 1600s.
What are the barriers to African American assimilation? There are many reasons for the lack of acceptance of African Americans into the main- stream of U.S. society. Skin color and physical features make it possible to identify at a glance people of African American lineage. This makes it easy for the dominant white ethnic group to create negative stereotypes based on physical characteristics.
A second reason for the continuing minority status of African Americans has its roots in early American history. Brought into the country to labor on plantations, African Americans were immediately assigned to the lowest class status. Even when freed, ex-slaves and their descendants in the United States
40 35 30 25 20 15 10
5
35.3 33.9
10.5
African American
Latino
Asian/Pacific Islander
Native American/Alaskan Native
2.1 1980 1981 1982 1983 1984 1985 1986 1987 1988 1989 1990 1991 1992 1993 1994 1995 1996 1997 1998 1999 2000
0
Figure 9.4 U.S. Resident Minority Populations, 1980–2000. This graph shows the increase in the larger minority populations in the United States since 1980. Are you surprised by the growth of any group?
Source: U.S. Bureau of the Census, 2000.
Population (in millions)
