
Page 330 - Sociology and You
P. 330
300 Unit 3 Social Inequality
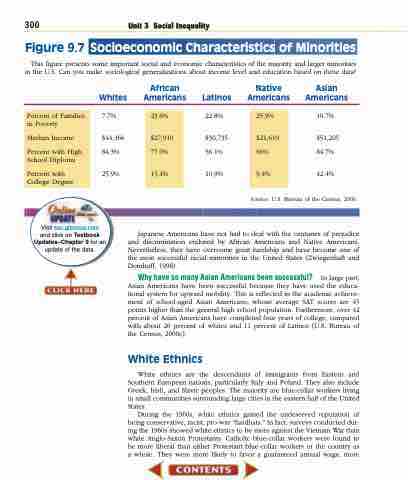
Figure 9.7 Socioeconomic Characteristics of Minorities
This figure presents some important social and economic characteristics of the majority and larger minorities in the U.S. Can you make sociological generalizations about income level and education based on these data?
Whites
7.7%
$44,366 84.3%
25.9%
Visit soc.glencoe.com and click on Textbook Updates–Chapter 9 for an update of the data.
African Americans
Latinos
22.8%
$30,735 56.1%
10.9%
Native Americans
Asian Americans
10.7%
$51,205 84.7%
Percent of Families in Poverty
Median Income
Percent with High School Diploma
Percent with College Degree
23.6%
$27,910 77.0%
15.4%
25.9%
$21,619 66%
9.4%
42.4%
Source: U.S. Bureau of the Census, 2000.
Japanese Americans have not had to deal with the centuries of prejudice and discrimination endured by African Americans and Native Americans. Nevertheless, they have overcome great hardship and have become one of the most successful racial minorities in the United States (Zwiegenhaft and Domhoff, 1998).
Why have so many Asian Americans been successful? In large part, Asian Americans have been successful because they have used the educa- tional system for upward mobility. This is reflected in the academic achieve- ment of school-aged Asian Americans, whose average SAT scores are 45 points higher than the general high school population. Furthermore, over 42 percent of Asian Americans have completed four years of college, compared with about 26 percent of whites and 11 percent of Latinos (U.S. Bureau of the Census, 2000c).
White Ethnics
White ethnics are the descendants of immigrants from Eastern and Southern European nations, particularly Italy and Poland. They also include Greek, Irish, and Slavic peoples. The majority are blue-collar workers living in small communities surrounding large cities in the eastern half of the United States.
During the 1960s, white ethnics gained the undeserved reputation of being conservative, racist, pro-war “hardhats.” In fact, surveys conducted dur- ing the 1960s showed white ethnics to be more against the Vietnam War than white Anglo-Saxon Protestants. Catholic blue-collar workers were found to be more liberal than either Protestant blue-collar workers or the country as a whole. They were more likely to favor a guaranteed annual wage, more
