
Page 567 - Sociology and You
P. 567
Chapter 16 Population and Urbanization
537
North America Asia Oceania Latin America Africa Europe ess Developed Areas Developed Areas World
0
2000
4000 6000
North America Asia Oceania Latin America Africa Europe Less Developed Areas Developed Areas 137 World
North America Asia Oceania Latin America 120% Africa Europe Less Developed Areas Developed Areas World
0 2000 6000
Doubling Time (in Years)
10,000
Population 2001
(in Millions)
Population Projection for 2050
(in Millions)
316
3,720
31
525
818 727
4,944 1,193
6,
450
5,262
46 815
1,800 662
7,794 1,242
9,036
Projected Population Change Between 2001 and 2050
139 50
63 41
29 *
43
6
53
North America Asia Oceania Latin America Africa Europe ess Developed Areas Developed Areas World
93
–100 20 40 60 80
0
*Doubling not projected to occur.
43% 41%
49% 55%
–9%
58%
4%
47%
200 400
600
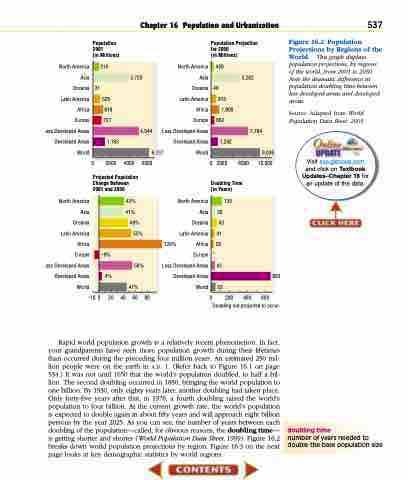
Figure 16.2 Population Projections by Regions of the World. This graph displays population projections, by regions of the world, from 2001 to 2050. Note the dramatic difference in population doubling time between less developed areas and developed areas.
Source: Adapted from World Population Data Sheet, 2001.
L
Visit soc.glencoe.com and click on Textbook Updates–Chapter 16 for an update of the data.
L
Rapid world population growth is a relatively recent phenomenon. In fact, your grandparents have seen more population growth during their lifetimes than occurred during the preceding four million years. An estimated 250 mil- lion people were on the earth in A.D. 1. (Refer back to Figure 16.1 on page 534.) It was not until 1650 that the world’s population doubled, to half a bil- lion. The second doubling occurred in 1850, bringing the world population to one billion. By 1930, only eighty years later, another doubling had taken place. Only forty-five years after that, in 1976, a fourth doubling raised the world’s population to four billion. At the current growth rate, the world’s population is expected to double again in about fifty years and will approach eight billion persons by the year 2025. As you can see, the number of years between each doubling of the population—called, for obvious reasons, the doubling time— is getting shorter and shorter (World Population Data Sheet, 1999). Figure 16.2 breaks down world population projections by region. Figure 16.3 on the next page looks at key demographic statistics by world regions.
doubling time
number of years needed to double the base population size
