
Page 568 - Sociology and You
P. 568
538
Unit 5 Social Change
Crude Birth Rates
Russia Europe Canada
North America United States China Oceania Asia Latin America Africa Developed Areas Developing Areas (excluding China) World
Russia Europe Canada
North America United States China Oceania Asia Latin America Africa Developed Areas Developing Areas (excluding China) World
Total Fertility Rates
Russia Europe Canada
North America United States China Oceania Asia Latin America Africa Developed Areas Developing Areas (excluding China) World
Russia Europe Canada
North America United States China Oceania Asia Latin America Africa Developed Areas Developing Areas (excluding China) World
9 10
11 14
15 15
18 22
24
38
11
28
22
1.2 1.4
1.4 2.0
2.1 1.8
2.5 2.7
2.8
5.2
1.6
3.6
2.8
0510152025303540
Crude Death Rates
0 1 2 3 4 5 6
Infant Mortality Rates
15 11
8 9
9 6
7 8
6
14
10 9
9
0 3 6 9 12 15
0 20 40 60 80 100
16 9
6 7 7
31 28
55 31
88 67
8
56
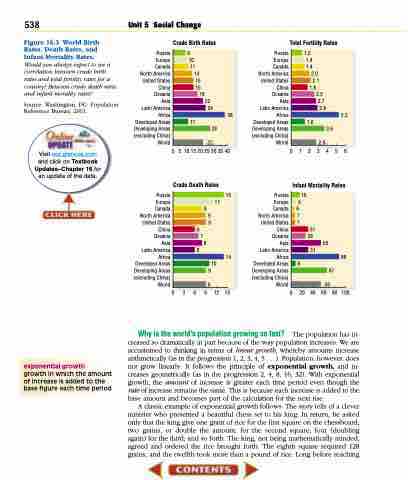
Figure 16.3 World Birth Rates, Death Rates, and Infant Mortality Rates.
Would you always expect to see a correlation between crude birth rates and total fertility rates for a country? Between crude death rates and infant morality rates?
Source: Washington, DC: Population Reference Bureau, 2001.
Visit soc.glencoe.com and click on Textbook Updates–Chapter 16 for an update of the data.
exponential growth
growth in which the amount of increase is added to the base figure each time period
The population has in- creased so dramatically in part because of the way population increases. We are accustomed to thinking in terms of linear growth, whereby amounts increase arithmetically (as in the progression 1, 2, 3, 4, 5 . . .). Population, however, does not grow linearly. It follows the principle of exponential growth, and in- creases geometrically (as in the progression 2, 4, 8, 16, 32). With exponential growth, the amount of increase is greater each time period even though the rate of increase remains the same. This is because each increase is added to the
base amount and becomes part of the calculation for the next rise.
A classic example of exponential growth follows: The story tells of a clever minister who presented a beautiful chess set to his king. In return, he asked only that the king give one grain of rice for the first square on the chessboard; two grains, or double the amount, for the second square; four (doubling again) for the third; and so forth. The king, not being mathematically minded, agreed and ordered the rice brought forth. The eighth square required 128 grains, and the twelfth took more than a pound of rice. Long before reaching
Why is the world’s population growing so fast?
