
Page 576 - Sociology and You
P. 576
546 Unit 5 Social Change
4.5
1995
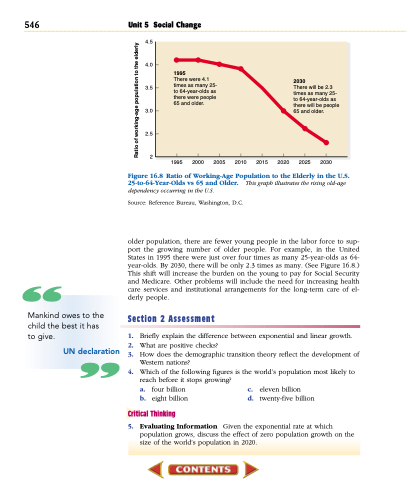
There were 4.1 times as many 25- to 64-year-olds as there were people 65 and older.
2030
There will be 2.3 times as many 25- to 64-year-olds as there will be people 65 and older.
4.0
3.5
3.0
2.5
2
1995 2000
2005 2010
2015 2020
2025 2030
Figure 16.8 Ratio of Working-Age Population to the Elderly in the U.S. 25-to-64-Year-Olds vs 65 and Older. This graph illustrates the rising old-age dependency occurring in the U.S.
Source: Reference Bureau, Washington, D.C.
“Mankind owes to the child the best it has to give.
UN declaration
older population, there are fewer young people in the labor force to sup- port the growing number of older people. For example, in the United States in 1995 there were just over four times as many 25-year-olds as 64- year-olds. By 2030, there will be only 2.3 times as many. (See Figure 16.8.) This shift will increase the burden on the young to pay for Social Security and Medicare. Other problems will include the need for increasing health care services and institutional arrangements for the long-term care of el- derly people.
Section 2 Assessment
1. Briefly explain the difference between exponential and linear growth.
2. What are positive checks?
3. How does the demographic transition theory reflect the development of
Western nations?
4. Which of the following figures is the world’s population most likely to
reach before it stops growing?
a. four billion c. eleven billion
b. eight billion d. twenty-five billion
Critical Thinking
5. EvaluatingInformation Giventheexponentialrateatwhich population grows, discuss the effect of zero population growth on the size of the world’s population in 2020.
Ratio of working-age population to the elderly
“
