
Page 19 - S44 Compendium
P. 19
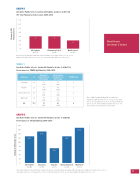
GRAPH 1
Ann Arbor Public Schools System 44 Students, Grades 3–8 (N=118) SPI Total Fluency by School Level, 2009–2010
7.0 6.0 5.0 4.0 3.0 2.0 1.0
0
All Students
(N=118)
Elementary School
(n=92)
Middle School
(n=26)
3
3
Northern United States
2
Note. Fluency SPI gains were signi cant for the elementary school sample (Fluency: t=6.32, p=.00), middle school sample (Fluency: t=2.62, p=.01), and overall sample (Fluency: t=6.83, p=.00).
TABLE 1
Ann Arbor Public Schools System 44 Students, Grades 3–8 (N=113) Performance on TOWRE by Ethnicity, 2009–2010
Subgroup
N
Mean Fall Standard Score (Percentile)
Mean Spring Standard Score (Percentile)
TOWRE Gain
Caucasian
30
76 (5th)
79 (8th)
3
Hispanic
22
82 (12th)
85 (16th)
3
African American
47
75 (5th)
79 (8th)
4
Multiracial
14
75 (5th)
80 (9th)
5
All
113
77
(6th)
81
(10th)
4
Note. TOWRE Total Word Reading Ef ciency gains were statistically signi cant overall (t=6.26, p=.00), for Caucasians (t=2.56, p=.02), Hispanics (t=3.55, p=.00), African Americans (t=3.99, p=.00), and for multiracial students (t=2.17, p=.05). Values in table are rounded to the nearest integer.
GRAPH 2
Ann Arbor Public Schools System 44 Students, Grades 3–8 (N=90) Performance on SRI by Ethnicity, 2009–2010
180 160 140 120 100
80 60 40 20
0
All Students
(N=90)
Caucasian
(n=26)
Hispanic
(n=21)
African American
(n=26)
Multiracial
(n=12)
164L
153L
123L
126L
70L
Note. Asian students (n=2) and Other Race students (n=3) were not included in the above graph. SRI Lexile gains were signi cant overall (t=8.02, p=.00), for Caucasians (t=4.42, p=.00), Hispanics (t=3.71, p=.00), African Americans (t=5.18, p=.00), and for multiracial students (t=2.56, p=.00).
17
Change in SRI Lexile Score
Change in SPI Fluency Score
