
Page 21 - S44 Compendium
P. 21
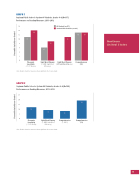
GRAPH 1
Saginaw Public Schools System 44 Students, Grades 4–8 (N=317) Performance on Reading Measures, 2011–2012
16 14 12 10
8 6 4 2 0
All Students (n=317)
Students With Disabilites (n=165)
14
13
13
11
11
9
6
Phonemic
Sight Word Fluency
Sight Word Fluency
Comprehension
(SRI)
Sensitivity
(SPI Sight Word Fluency) Note. Results shown for measures where signi cant effects were found.
GRAPH 2
Saginaw Public Schools System 44 Students, Grades 6–8 (N=145) Performance on Reading Measures, 2011–2012
(CTOPP Elision)
(TOWRE Sight Word Ef ciency)
25 20 15 10
5 0
Phonemic
Sensitivity
(CTOPP Elision)
Sight Word Fluency
(TOWRE Sight Word Ef ciency)
Comprehension
(TOSREC)
Comprehension
(SRI)
Note. Results shown for measures where signi cant effects were found.
9
8
19
Northern United States
12
19
Percentile Gain Above Control Percentile Gain Above Control
