
Page 25 - S44 Compendium
P. 25
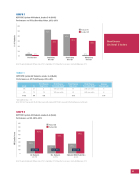
GRAPH 1
KIPP NYC System 44 Students, Grades 5–6 (N=56) Performance on SPI by Decoding Status, 2012–2013
60%
50%
40%
30%
20%
10%
0%
4%
2%
Pretest SPI Posttest SPI
Advancing Decoder
52%
32%
43%
36%
Northern United States
2%
30%
Pre-Decoder
Beginning Decoder
Developing Decoder
Note. The pretest window for SPI was June 2012 to September 2012. All posttest scores were collected in May–June 2013.
TABLE 1
KIPP NYC System 44 Students, Grades 5–6 (N=56) Performance on SPI Total Fluency, 2012–2013
*Gain signi cant at p < .05.
Note. SPI Form 1 was used for the  rst  uency percentile rank, and SPI Form 3 was used for the  nal  uency percentile rank.
Grade
N
First Fluency Raw Score
First Fluency Percentile Rank*
Final Fluency Raw Score
Final Fluency Percentile Rank*
Average Fluency Gain
5th
41
8
10th percentile
16
24th percentile
8
6th
15
14
12th percentile
22
28th percentile
8
Total
56
9.8
17.3
7.5*
GRAPH 2
KIPP NYC System 44 Students, Grades 5–6 (N=56) Performance on SRI, 2012–2013
800 700 600 500 400 300 200 100
0
All Students
ELL Students
Students With Disabilities
Pretest SRI Posttest SRI
627L
519L
582L
326L
261L
211L
Gain: 301L
Gain: 308L
Gain: 321L
(N=56)
Note. The pretest window for SRI was June 2012 to September 2012. All posttest scores were collected in May–June 2013.
(n=18)
(n=23)
23
SRI Lexile Score % of Students
